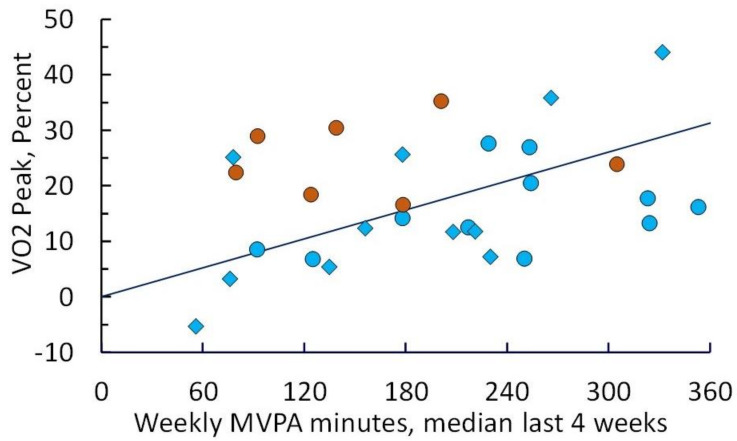
Figure 3.
Improvement in cardiopulmonary fitness after 12 and 24 weeks of intervention as measured by peak oxygen consumption (VO2peak) relative to baseline, plotted as a function of weekly MVPA achieved (median of recorded values weeks 9–12 or weeks 21–24). Diamonds denote participants in cohort 1; circles denote participants in cohort 2 (blue = 12-week values; orange = 24-week values). Linear regression yields a slope of 0.057% change in VO2peak per min of MVPA (p = 0.021).

