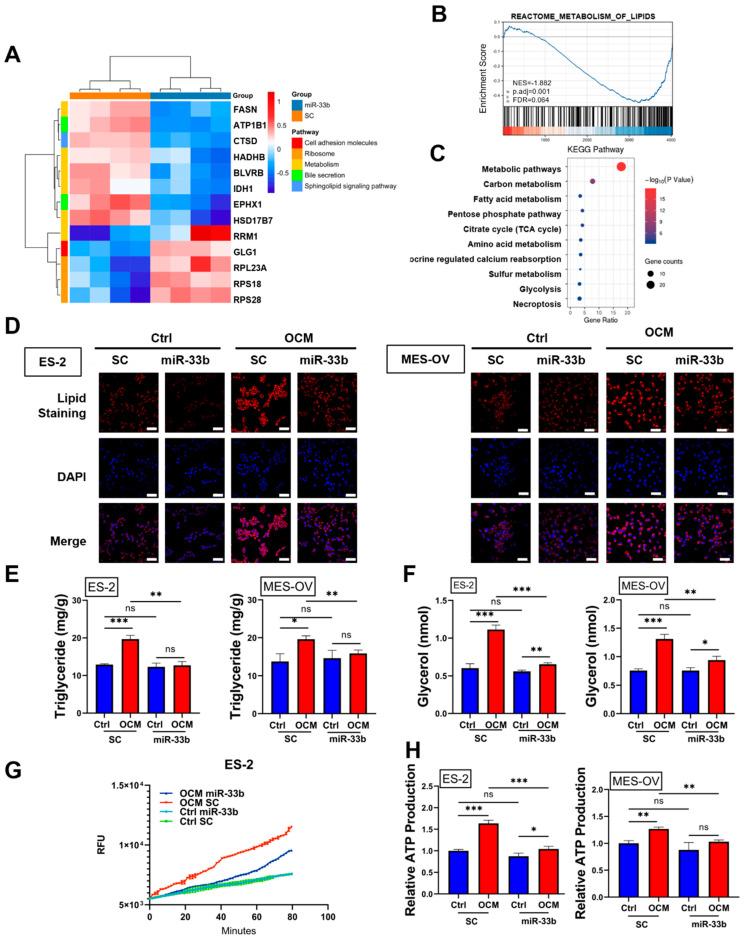
Figure 3.
miR-33b regulates OCM-mediated lipid metabolic reprogramming of ovarian cancer cells. (A) Stable polyclonal ES-2 cell line with overexpression of miR-33b or scrambled control was treated with OCM for 24 h, and subsequently, total protein was extracted for LC-MS/MS proteomic study. Some of the downregulated and upregulated genes in stable miR-33b overexpressing ES-2 cells relative to scrambled control ES-2 cells were presented by heatmap. (B) Gene set enrichment analysis (GSEA) was employed to show the biological pathways that enriched in ES-2 cells overexpressing miR-33b compared to scrambled control. (C) Functional enrichment analysis was performed on 92 genes downregulated by miR-33b overexpression using KEGG database. (D–H) Ovarian cancer cell lines (ES-2 and MES-OV) were treated as described in (A), and lipid metabolic activities were examined. (D) Lipid droplet formation was assessed by immunofluorescent and lipid staining analyses. Lipid droplet was counterstained by Nile red (in red) and nuclei were stained by DAPI (in blue) before visualization with Zeiss LSM 980 (Zeiss, Jena, Germany). Scale bar: 50 μm. (E). The triglyceride level of ovarian cancer cells was quantified by Triglyceride Assay. (F) Lipolysis activity of ES-2 and MES-OV cells was detected by Lipolysis Colorimetric Assay. (G) β-oxidation of fatty acid was continuously monitored by Fatty Acid Oxidation Assay over time. (H) Cellular ATP production of ovarian cancer cells was determined by Luminescent ATP Detection Assay. (ns, no significant difference, * p < 0.05, ** p < 0.01, *** p < 0.001).

