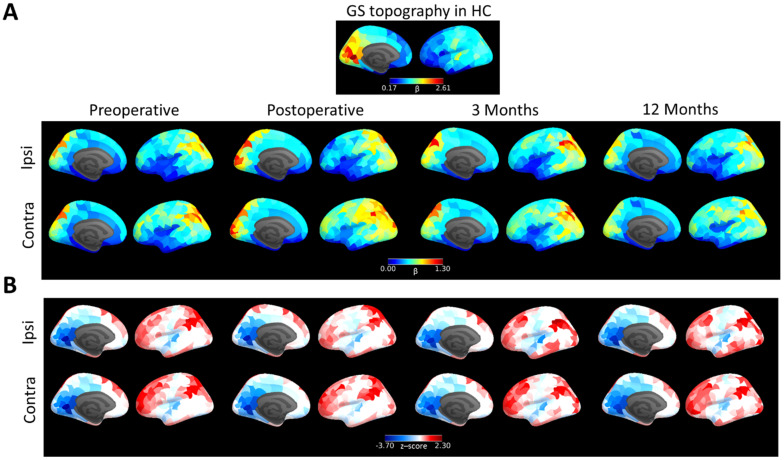
Figure 3.
GS topography of brain tumour patients. (A). GS topography of HCs compared with brain tumour patients scanned before surgery (leftmost column), within a week after surgery (second column) and 3 months (third column) and 12 months follow-up (rightmost column) for the hemisphere containing the tumour (ipsi) and the contralateral healthy hemisphere (contra). (B). GS topography of brain tumour patients normalised to HC values (z-scores; blue represents reduced regional coupling with GS in patients compared with HCs).

