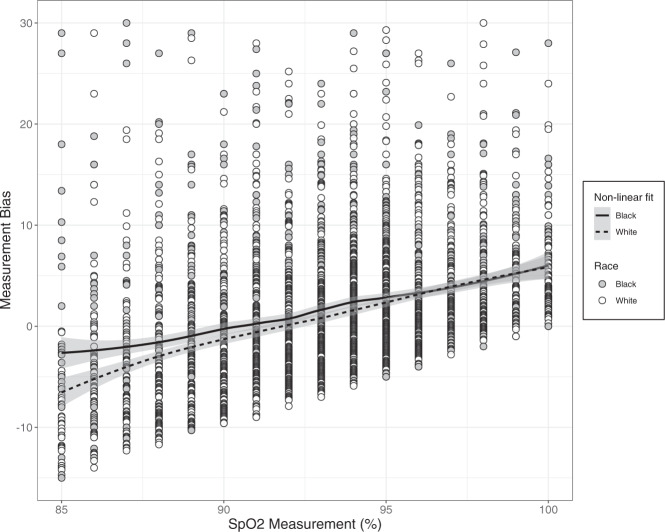
Fig. 4. Measurement bias is shown, clustered by SpO2 saturation and race over the clinically relevant SpO2 range of 85-100%.
Black infants are shown as gray dots, White infants are shown as white dots. Non-linear regression lines are shown for each group (solid for Black infants, dashed for White infants). Shaded areas represent 95% CI.

