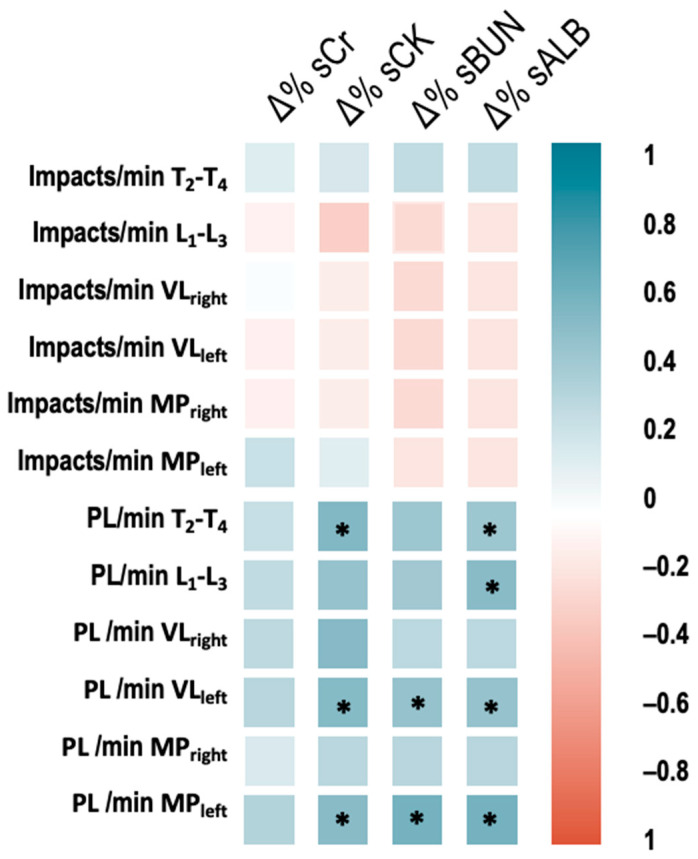
Figure 3.
Correlation between percentage of change (pre vs. post0h) of serum values and accelerometric load (impacts and Player Load). * significant correlation p < 0.05. PL = player load, T2–T4 = thoracic 2nd–4th, L1–L3 = lumbar 1st–3rd; VLright and VLleft = vastus lateralis and MPright and MPleft = malleolus peroneus.

