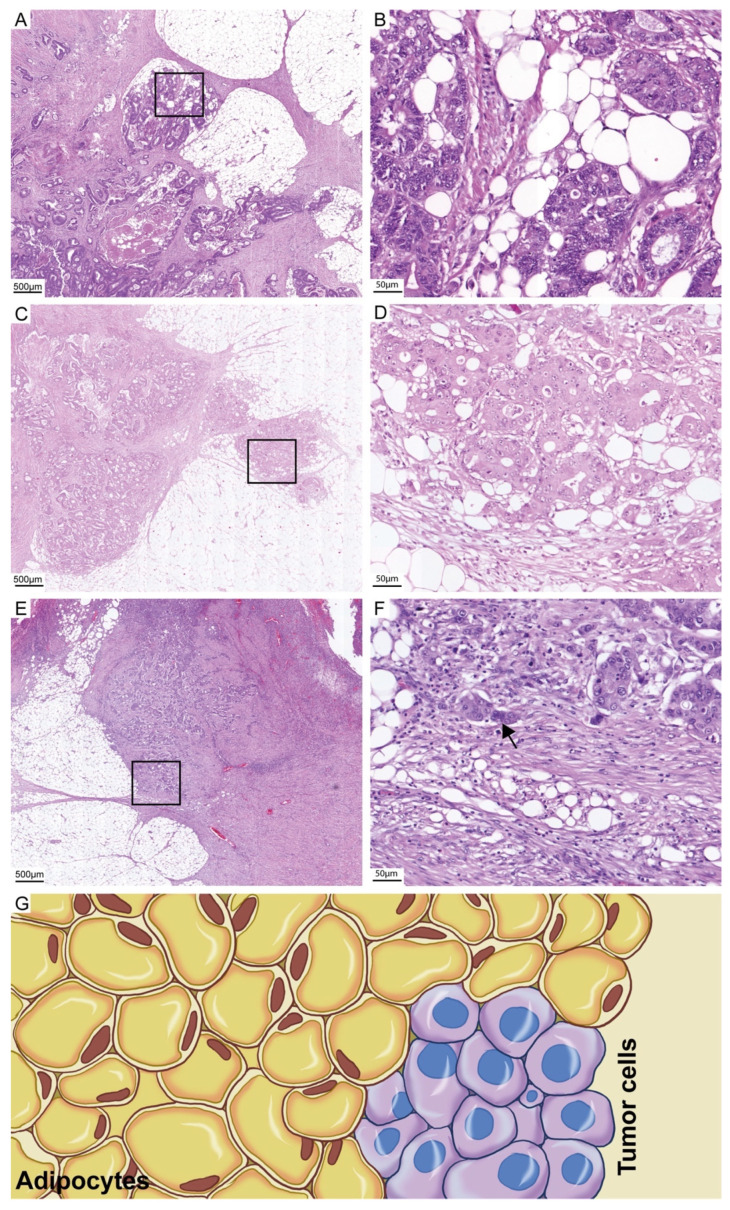
Figure 1.
H & E images of SARIFA-positive and SARIFA-negative cases: SARIFA-positive cases (A,C: scale bar 500 µm; B,D: scale bar 50 µm) SARIFA-negative case at the invasion front with a PDC (arrow) (E: scale bar 500 µm, F; scale bar 50 µm). Schematic representation of a SARIFA area with tumor cells directly adjacent to adipocytes without a stromal reaction (G).

