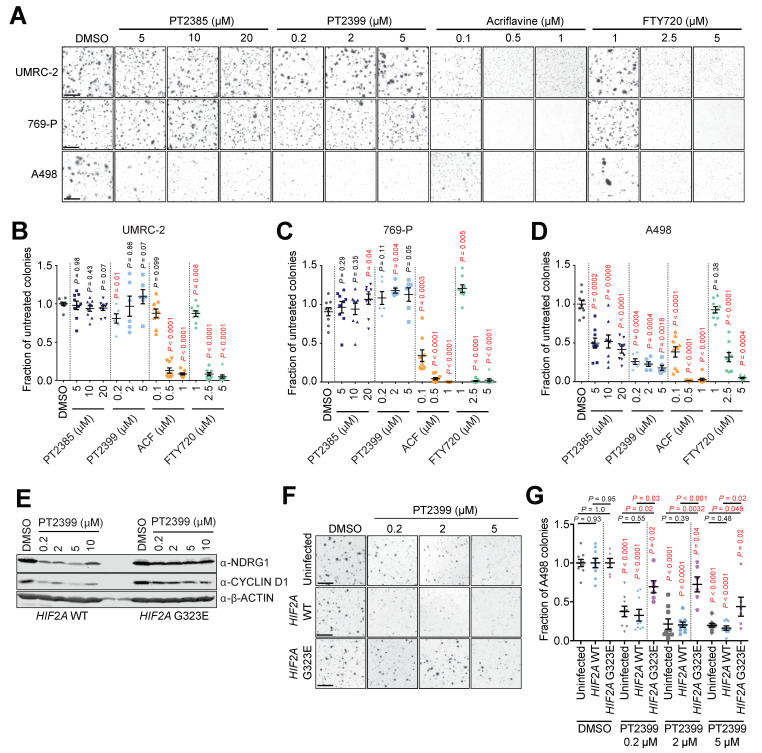
Figure 4.
Inhibition of anchorage-independent growth of human ccRCC cells. (A) Representative images of stained soft agar colonies formed after 4 weeks of growth of UMRC-2, 769-P, and A498 cells in the presence of DMSO (control) or the indicated doses of the indicated drugs. Scale bar = 100 μm. (B–D) Quantifications of colony formation, expressed as the fraction of colonies formed in untreated cultures in UMRC-2 (B), 769-P (C), and A498 (D) cells treated with the indicated doses of the indicated drugs. Data are derived from 2 (for PT2399) and 3 (all other treatments) independent experiments, each conducted in triplicate and are displayed as mean ± SEM. p-values for pairwise comparisons were calculated by Student’s t-test followed by two-sided Mann–Whitney U test without adjustments for multiple comparisons. (E) Immunoblots of HIF2A WT (left panel) and HIF2A G323E (right panel) for NDRG1, CYCLIND D1, and β-ACTIN after 48 h of treatment with DMSO or PT2399 in the indicated concentrations. (F) Representative images of stained soft agar colonies formed after 4 weeks of growth of A498, HIF2A WT, and HIF2A G323E cells in presence of DMSO (control) or the indicated doses of PT2399. Scale bar = 100 µm. (G) Quantifications of colony formation, expressed as the fraction of colonies formed in cultures of A498, HIF2A WT, and HIF2A G323E cells treated with DMSO or PT2399 in the indicated concentrations. Data are derived from 2 (HIF2A G323E) and 3 (A498 and HIF2A WT) independent experiments, each conducted in triplicate and are displayed as Mean ± SEM. p-values for pairwise comparisons were calculated by Student’s t-test followed by two-sided Mann–Whitney U test without adjustments for multiple comparisons.

