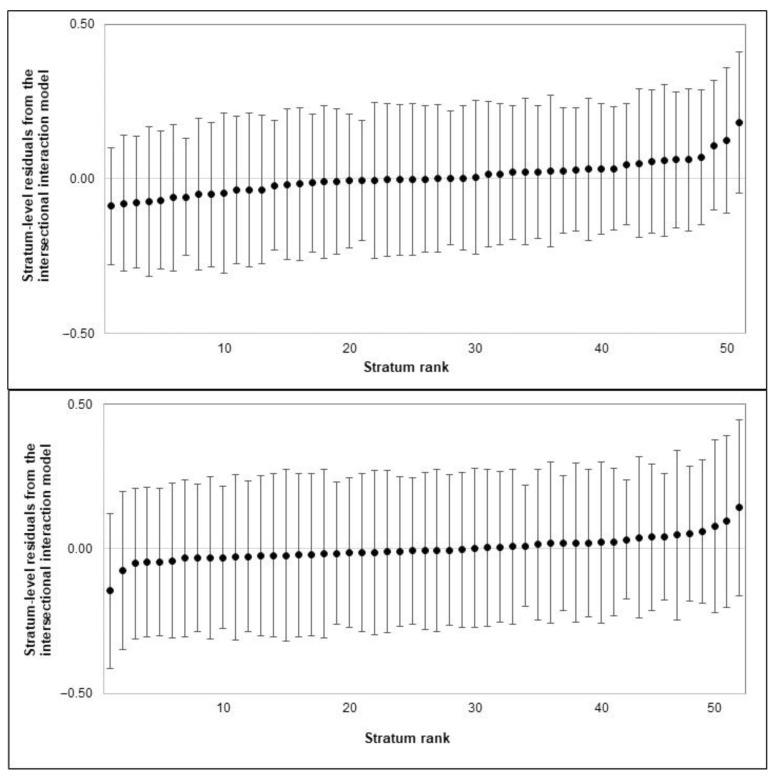
Figure 2.
Intersectional interaction effects of ethnicity, nativity status and education on the numbers of teeth with PD (top plot) and CAL (bottom plot). Stratum residuals are the remaining difference between total predicted values for each stratum and stratum-level predictions based on additive effects only. Markers indicate estimated effects, and whiskers indicate 95% credible intervals. Intersectional strata were ordered according to their interaction effect. Negative and positive values indicate the number of teeth affected was below and above predicted scores for a given stratum, respectively.

