Figure 2.
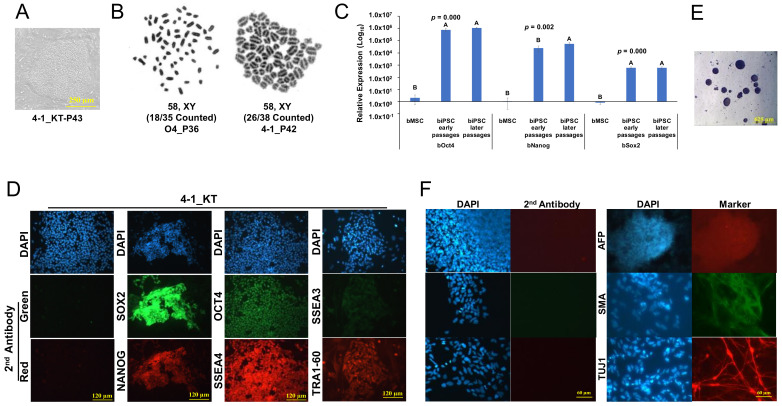
Characterization of primed-like bovine iPSCs. (A): Flat colony morphology of 4-1 in KT medium. Bar = 250 µm. (B): Karyotype for O4 and 4-1 biPSC lines at passage 36 and 42, respectively. (C): qRT-PCR for endogenous expression of pluripotent genes in four lines of biPSCs at early passages (4-1 at P17, 4-6 at P17, 3-2 at P10) and later passages (4-1 at P43, 4-6 at P25, 3-2 at P29, O4 at P40). Bar = mean ± sd, n = 4. One way–ANOVA with Tukey’s post hoc multiple comparison test was used for data analysis. (D): Representative immunostaining images of biPSCs in KT medium for OCT4, NANOG, SOX2, SSEA3, SSEA4, TRA-1-60. Bar = 120 µm. (E): EBs formed from 4-1_KT, bar = 625 µm. (F): Immunostaining of differentiated cells for the three-germ layer markers (AFP for endoderm, SMA for mesoderm, and TUJ1 for ectoderm) after passaging of the EBs. bar = 120 µm.

