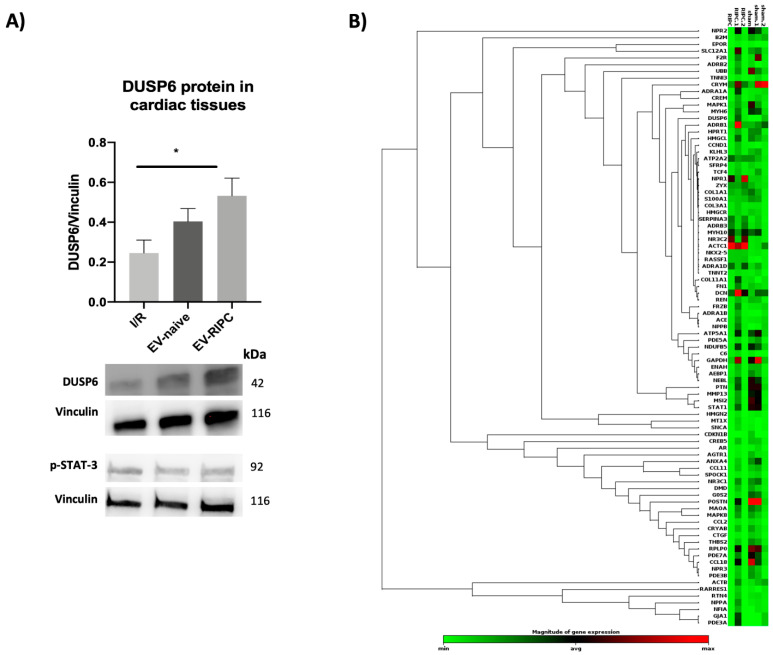
Figure 5.
DUSP6 content in cardiac tissue and EV heatmap. (A) Representative images of Western blot for DUSP6 and p-STAT-3. The histogram refers to DUSP6 expression in myocardial tissue. DUSP6 and p-STAT-3 expression were normalized to vinculin (n = 30) (* p = 0.02). (B) Hierarchical clustering of the entire dataset of expressed cardiovascular-linked genes. Clustergram displaying hierarchical clustering of the entire dataset of expressed genes across two different experimental groups: EV-RIPC and EV-naive (n = 3/each group). RNAs with higher differential expression levels are represented in red, while RNAs with lower detection levels are shown in green. Genes with similar expression patterns are grouped.

