Figure 2.
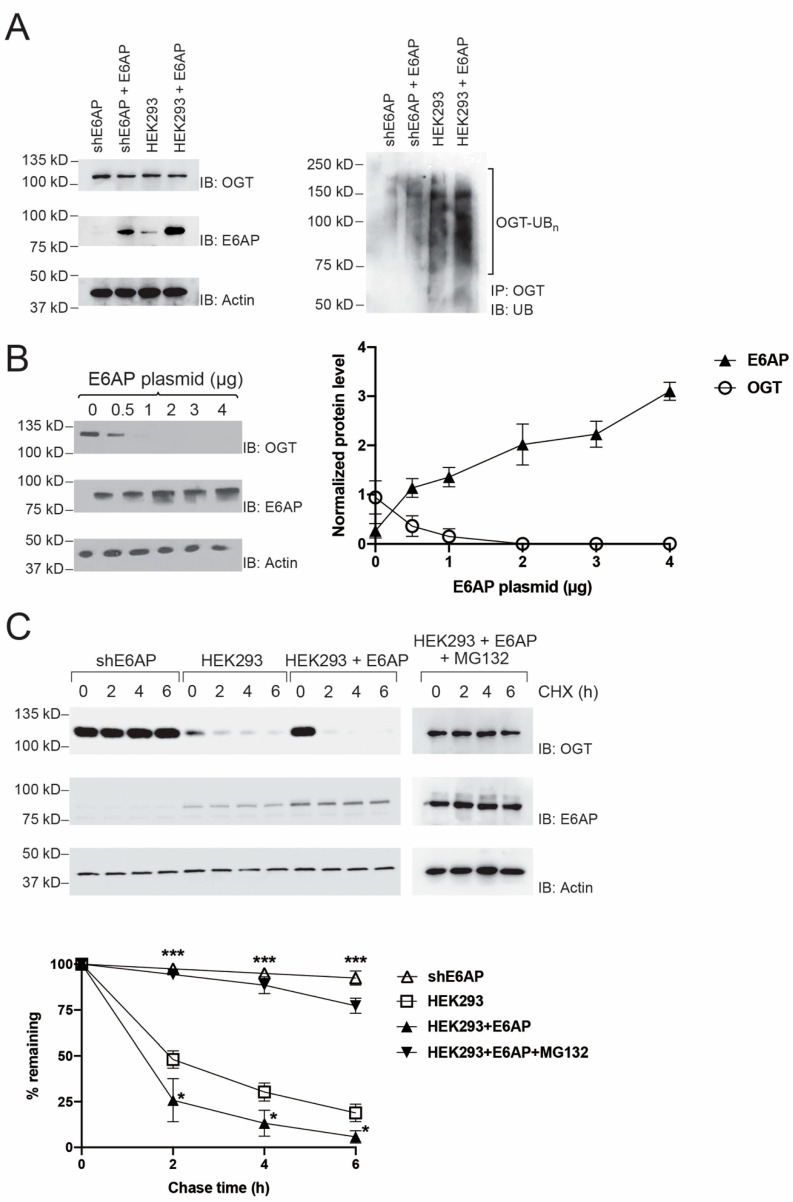
E6AP-catalyzed OGT ubiquitination and regulation of OGT stability in HEK293 cells. (A) Enhanced OGT ubiquitination with forced expression of E6AP in HEK293 cells. Left panels show inhibition of E6AP expression by anti-E6AP shRNA (shE6AP), and E6AP expression was restored by transfection of the plvx-E6AP plasmid into the shE6AP cells (shE6AP + E6AP). Additionally, HEK293 cells transfected with plvx-E6AP (HEK293 + E6AP) showed a higher level of E6AP expression than the blank cells (HEK293). The right panel shows the ubiquitination of OGT was enhanced with forced E6AP expression in the cells. The cells were treated with proteasome inhibitor MG132 for 4 h before the cell lysates were prepared for immunoprecipitation of OGT with an anti-OGT antibody. The precipitated samples were analyzed by SDS-PAGE and Western blotting with an anti-UB antibody. Ubiquitination of OGT was compared among HEK293 expressing shE6AP (shE6AP), HEK293 expressing both shE6AP and recombinant E6AP (shE6AP + E6AP), blank HEK293 cells (HEK293), and HEK293 expressing recombinant E6AP (HEK293 + E6AP). (B) E6AP decreased the steady-state level of OGT in HEK293 cells. Cells were transfected with different amounts of E6AP plasmid. Levels of OGT were assayed by immunoblotting of the cell lysates probed with an anti-OGT antibody. Quantitative analysis of OGT level in correlation with E6AP expression is plotted in the panel on the right. (C) E6AP-dependent degradation of OGT assayed by cycloheximide (CHX) chase. Cells were first treated with CHX to inhibit protein expression and harvested 0, 2, 4, and 6 h after incubation with CHX. OGT levels in the cell lysates were measured by immunoblotting with an anti-OGT antibody. The CHX chase assay was performed with shE6AP cells, blank HEK293 cells, HEK293 cells with E6AP overexpression (HEK293 + E6AP), and cells with E6AP overexpression and MG132 treatment (HEK293 + E6AP + MG132). Quantitative analysis of the OGT level in the cell was plotted in the panel underneath the blots. Data points show mean ± S.E. of three or more experiments. The vertical bars in (B,C) represent SEM from three independent experiments (n = 3). * p < 0.05 versus HEK293 control. *** p < 0.001 versus HEK293 control.

