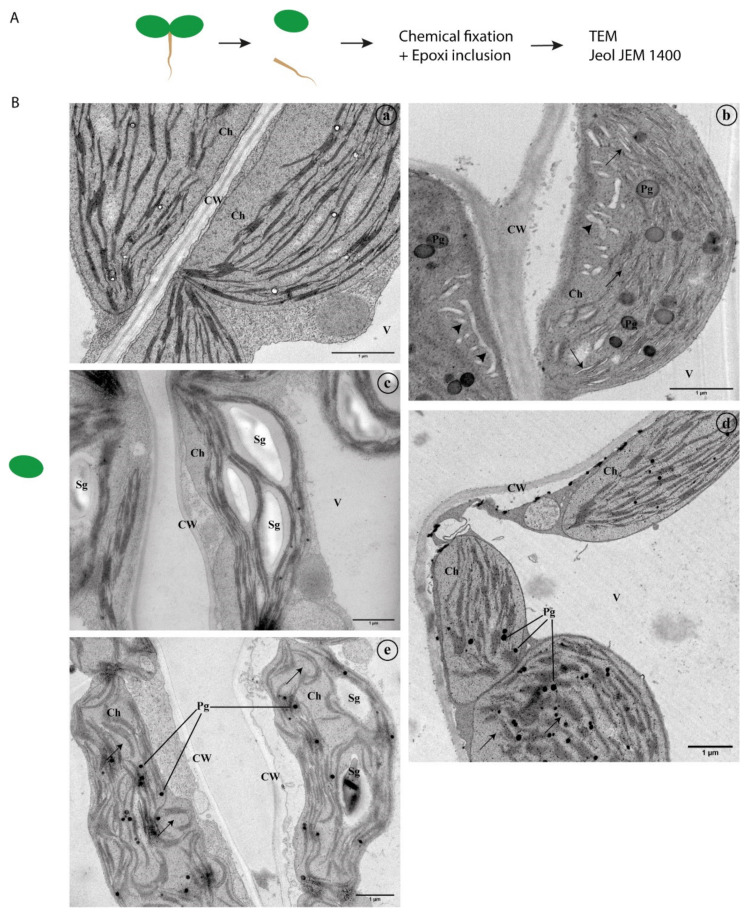
Figure 2.
Transmission electron microscopy analysis of A. thaliana leaf cells. (A) Workflow to perform transmission electron microscopy. (B) A. thaliana leaf cells visualisation under different stress conditions. (a)—Control; (b)—Saline Stress (100 mM NaCl); (c)—Hydric stress (100 mM NaCl); (d)—Oxidative stress; (e)—Zinc stress. Abbreviations: CW—Cell wall; Ch—Chloroplast; Pg—Plastoglobuli; Sg—Starch granules; V—Vacuole. Scale bars: 1 μm.

