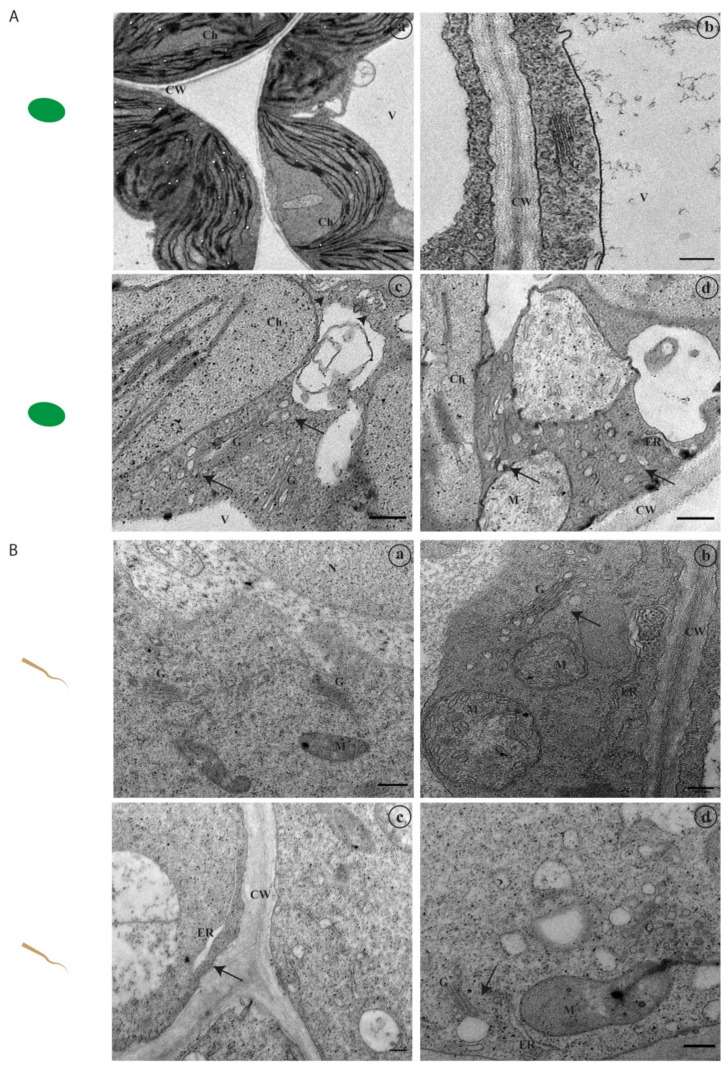
Figure 3.
Transmission electron microscopy analysis of A. thaliana leaf and root cells. (A) A. thaliana leaf cells visualisation and comparison between control condition (a,b) and oxidative stress condition (c,d). (B) A. thaliana root cells visualisation and comparison between control condition (a) and hydric stress (b) and oxidative stress condition (c,d). Abbreviations: CW—Cell wall; Ch—Chloroplast; ER—Endoplasmic Reticulum; G—Golgi, M—Mitochondria. Scale bars: (A) (a)—0.8 μm. (b)—200 nm. (c,d)—0.2 μm; (B) (a,c,d)—0.3 μm. (b)—150 nm.

