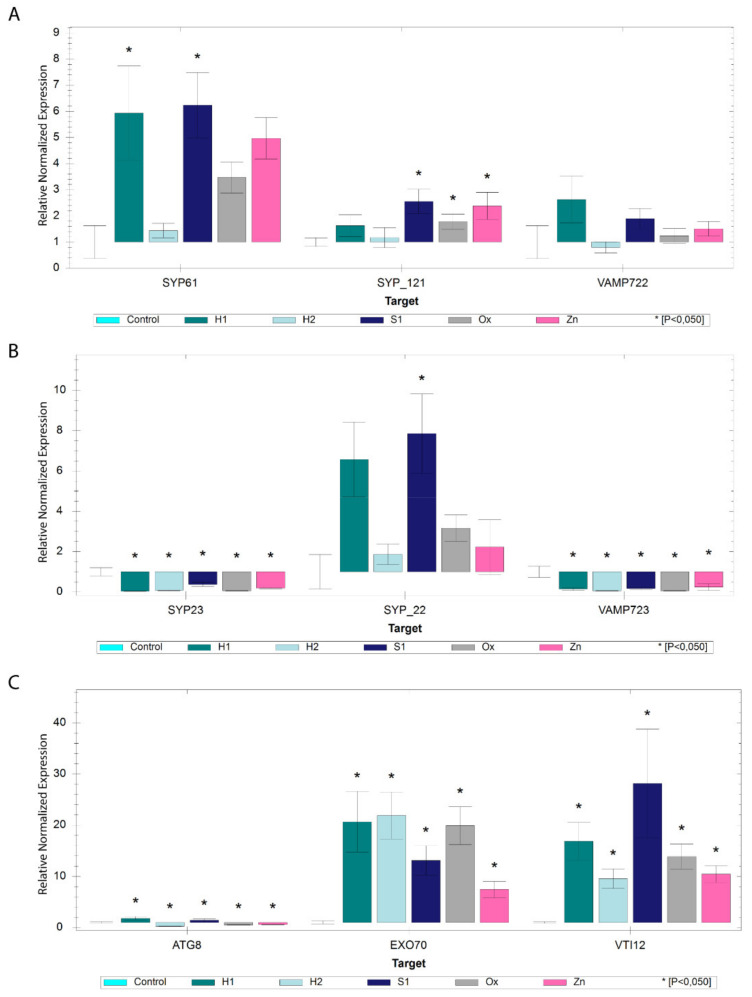
Figure 6.
Expression analysis by qRT-PCR of genes involved in plasma trafficking and autophagy/exocyst-mediated routes. (A) Bar chart analysis of AtSYP61, AtSYP121 and AtVAMP722 genes involved in cell membrane trafficking processes in different stress conditions relative to control. (B) Bar chart analysis of AtVAMP723, AtSYP23 and AtSYP22 genes in different stress conditions relative to control. (C) Bar chart analysis of AtExo70, AtVTI12 and AtATG8 genes involved in exocytosis and autophagy processes in different stress conditions relative to control. * indicates statistically experimental values (p < 0.05).

