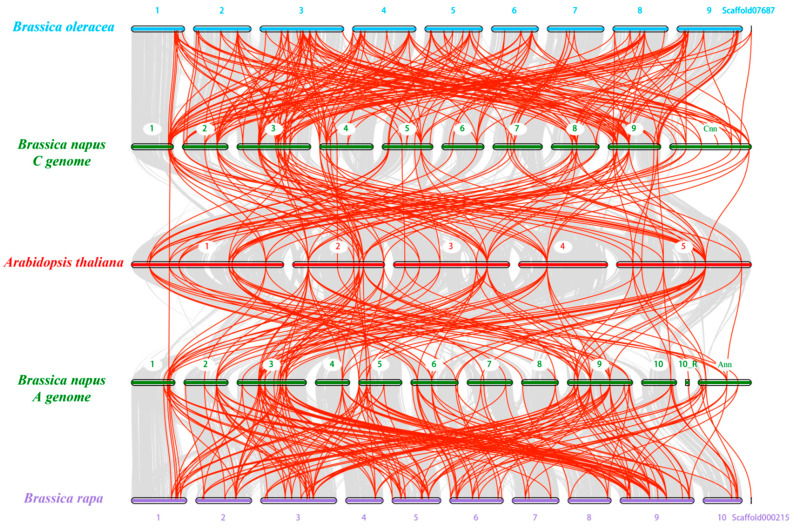
Figure 6.
Collinearity analysis of the NF-Y family genes in B. napus, B. rapa, B. oleracea and Arabidopsis chromosomes. The solid bars with different colors represent different chromosomes of the four species. The gray lines in the background suggest the syntenic blocks between the genomes of two species for comparison, while the red lines indicate the syntenic NF-Y gene pairs. R: random.

