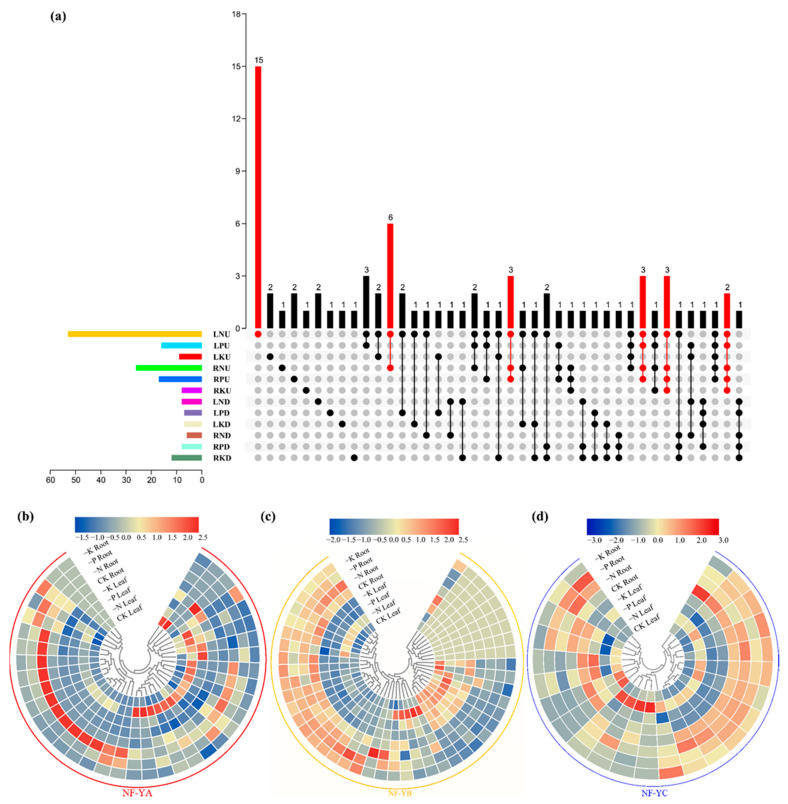
Figure 7.
Expression profiles of each NF-Y subfamily in rapeseed leaf and root under three nutrient deficient conditions. Seedlings 14 days old were cultivated under nitrogen, phosphorus and potassium deficient environments, respectively, for 6 days. The fully expanded leaf and root were harvested separately for RNA extraction. (a) Upset plot of significantly regulated genes under different treatments in two tissues. The red column represents the treatment with the highest number of genes in the same number of crosses; (b) The BnaNF-YA subfamily; (c) The BnaNF-YB subfamily; (d) The BnaNF-YC subfamily. The color scale is shown above each subfamily. The data in the heat map was normalized (z-scores) using FPKM values and then generated by Tbtools; the higher the value of the color scale, the higher the expression, and vice versa. −N: nitrogen deficiency; −P: phosphorus deficiency; −K: potassium deficiency; CK: sufficient nutrient supply. L: leaf; R: root; N: nitrogen deficiency; P: phosphorus deficiency; K: potassium deficiency. D: downregulated; U: upregulated.

