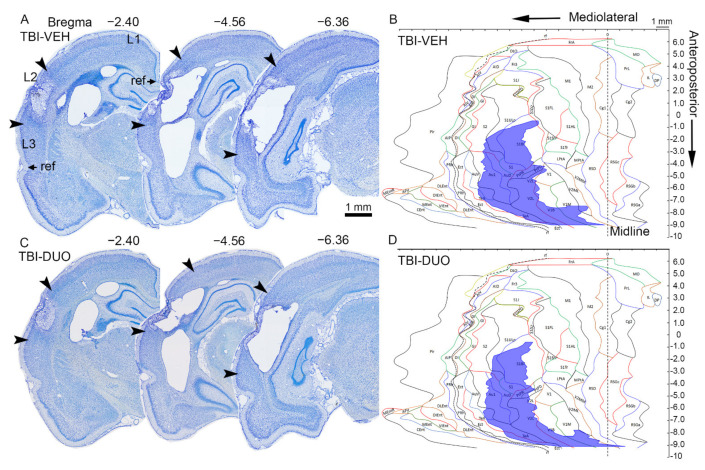
Figure 7.
Location and area (mm2) of the cortical lesion. (A) Representative thionin-stained coronal sections showing the rostrocaudal extent of the cortical lesion in a rat in the TBI-VEH group on day (D) 14 post-TBI. Arrowheads indicate the mediolateral lesion extent at different bregma levels (bregma –2.40 to –6.36). L1 is the length of the cortical surface from the medial reference point (arrow, cortical contact with the corpus callosum) to the upper edge of the lesion, L2 is the mediolateral extent of the lesion, L3 is the distance from the lower edge of the lesion to the rhinal fissure (arrow). (B) Computer-generated unfolded cortical map showing the lesion location on the cortical mantle (violet) from the same animal. (C) Cortical lesion of a rat in the TBI-DUO group on D14 post-TBI. (D) Unfolded cortical map from the same animal. SFN+NAC duotherapy had no effect on the total lesion area or location (see Table 1). Scale bar equals 1 mm in all panels. Abbreviations: D, day; DUO, duotherapy treated with N-acetylcysteine and sulforaphane; NAC, N-acetylcysteine; SFN, sulforaphane; TBI, traumatic brain injury; VEH, vehicle. For abbreviations, see also Table 1.

