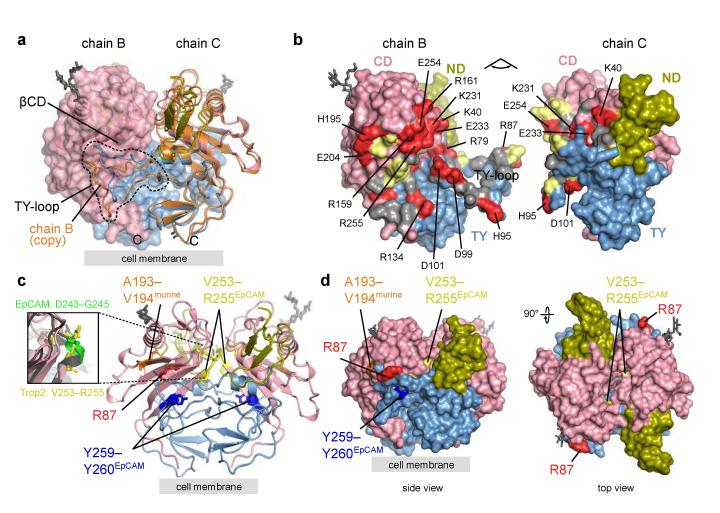
Figure 4.
Trop2 ectodomain dimer—alternative TY-loop conformation, interface residues, and location of proteolytic cleavage sites. Domain color-coding is the same as in Figure 3. Carbohydrate residues are shown as grey sticks. Position of the cell membrane (proximal to the C-termini) is denoted by a grey rectangle. (a) Assembly composed of chains B and C corresponds to a cis-dimer (Section 2.2.2). Both chains are shown in ribbon representation and for chain B a transparent molecular surface is shown. A copy of chain B superimposed on chain C is shown in orange showing an alternative TY-loop conformation within the same dimer. (b) Opened Trop2 ectodomain dimer in surface representation. Charged, polar and hydrophobic residues at the dimer interface are shown in red, yellow and grey. Charged residues are labeled. (c) Cleavage sites mapped to Trop2 ectodomain dimer (chains B and C, as in (a)). Matriptase and ADAM10 site is shown in red (R87), TACE site equivalent from murine Trop2 in orange (A193–V194), TACE site equivalent from human EpCAM in yellow (V253–R255), and BACE site equivalent from human EpCAM in dark blue (Y259–Y260). Zoomed-in section highlights different conformation of TACE cleavage site in EpCAM (D243–G245, bright green) and the location-equivalent site in Trop2 (V253–R255, yellow). (d) The same cleavage sites as in (c) shown on surface representation of Trop2 ectodomain dimer in two orientations.

