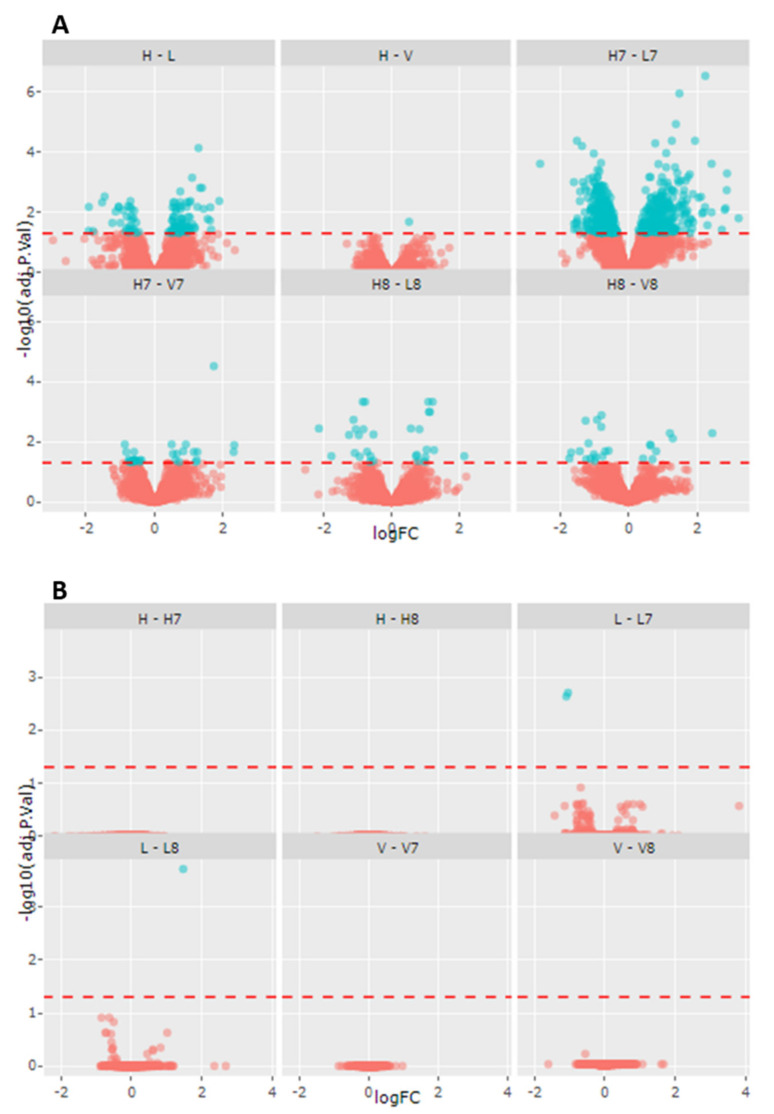
Figure 2.
Volcano plots illustrating differently expressed proteins in fibroblasts of healthy controls (n = 3), VLCADD (n = 3) and LCHADD (n = 3) under control conditions and after incubation either with C7 or C8. (A) Genotype effect. (B) Treatment effect. H: healthy controls; V: VLCADD; L: LCHADD. H7-V7-L7: healthy controls, VLCADD and LCHADD after incubation with C7. H8-V8-L8: healthy controls, VLCADD and LCHADD after incubation with C8.

