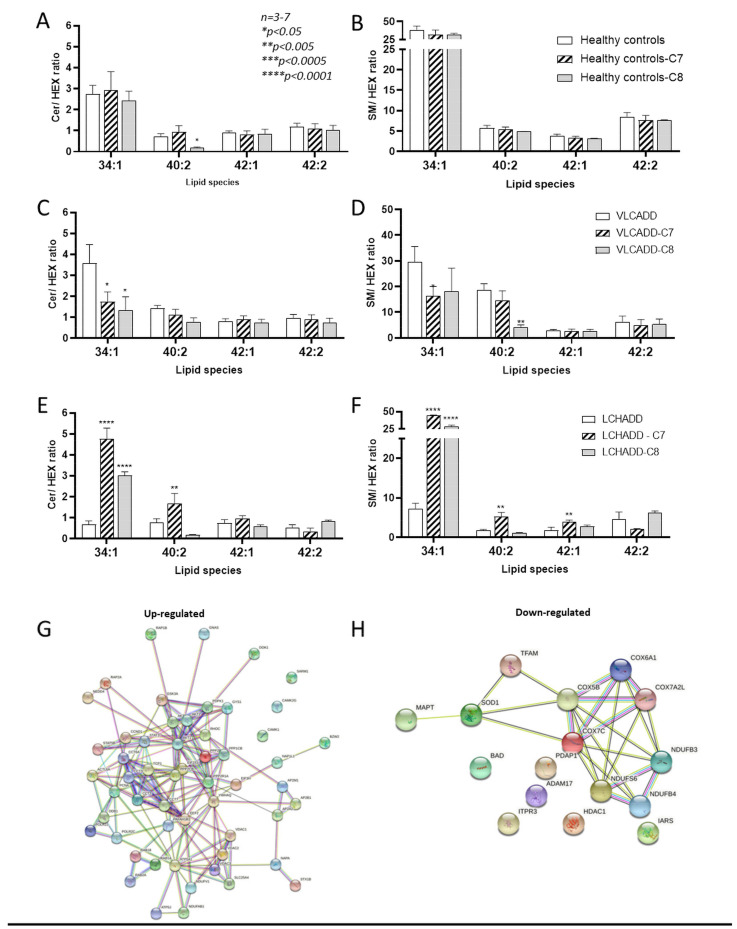
Figure 5.
Effect of mc-FAs on ceramide/hexosylceramide and sphingomyelin/hexosylceramide ratios for 34:1, 40:2, 42:1 and 42:2 species. (A,B) Healthy controls; (C,D) VLCADD fibroblasts; (E,F) LCHADD fibroblasts. (G,H) Up- and down-regulated LCHADD protein network after incubation with C7 identified via STRING software (http://www.string-db.org/; 12 May 2021). Values denoted by * were considered significant if p < 0.05, ** p < 0.005, *** p < 0.0005, **** p < 0.0001 (two way ANOVA, genotype and diet were used as independent factors; Mann‒Whitney test, Friedman test and Tukey’s Test); * indicates significant differences between healthy controls and diseases.

