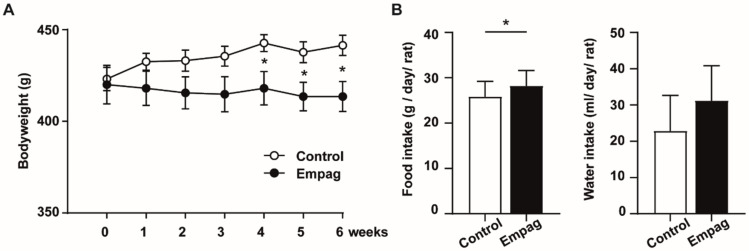
Figure 1.
Body weight, food and water consumption. (A) Body weight during 6 weeks of treatment of hHTG rats by empaglifozin compared to control hHTG rats. (B) Daily food and water intake are expressed as a food/water intake by cage and calculated by averaging for one animal/day over the entire course of the study. Control group (n = 7) and empagliflozin group (n = 8). The empagliflozin group received a standard diet enriched by 0.01% empagliflozin for 6 weeks. Data are expressed as mean ± SEM; * p ˂ 0.05.

