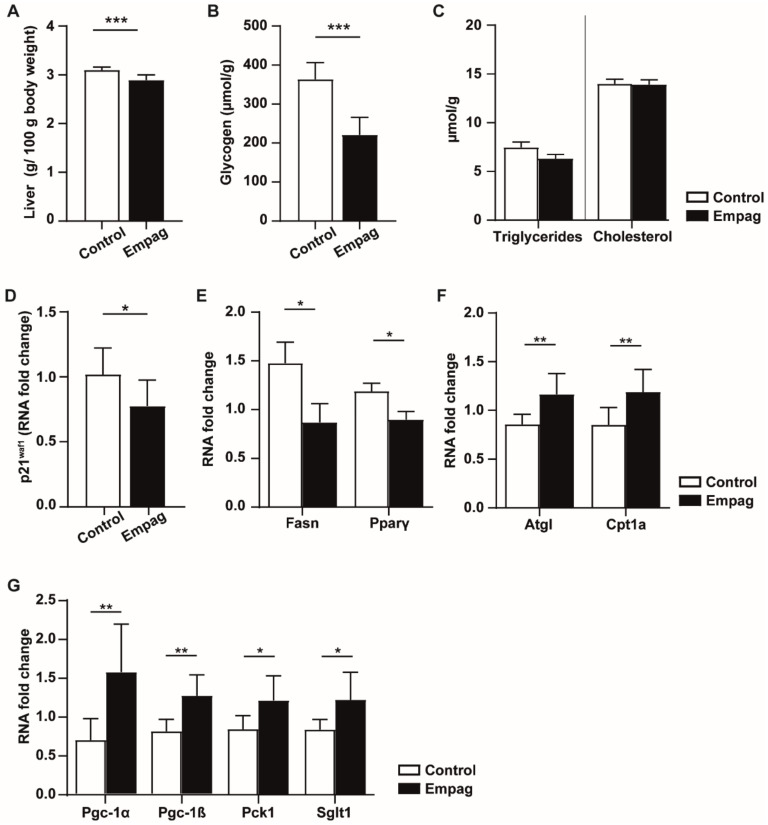
Figure 2.
Effect of empagliflozin on the liver. (A) Relative weight of the liver is expressed as the weight of the liver related to 100 g of body weight. (B) Glycogen concentration in the liver measured by the Anthron method. (C) Triglycerides and total cholesterol concentrations are related to the weight of tissue. (D–G) Changes of mRNA level of selected genes involved in senescence and lipid metabolism pathway. Control group (n = 7) and empagliflozin group (n = 8). Empagliflozin group received a standard diet enriched by 0.01% empagliflozin for 6 weeks. Data are expressed as mean ± SEM; * p ˂ 0.05; ** p ˂ 0.01; *** p ˂ 0.001.

