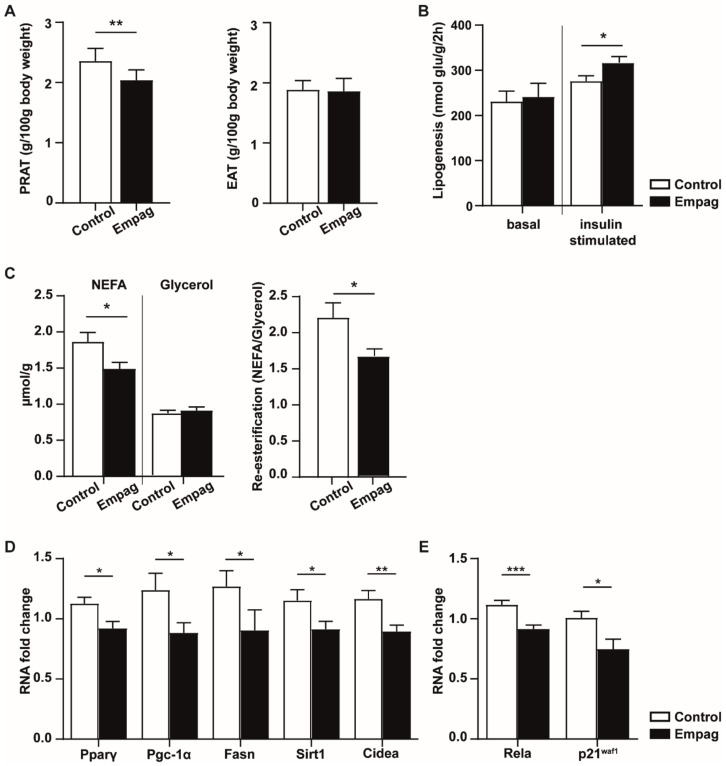
Figure 4.
Effect of empagliflozin on white adipose tissue. (A) Adiposity is expressed by relative weight to 100 g of body weight of perirenal (PRAT) and epididymal (EAT) adipose tissue mass. (B) Lipogenesis: glucose incorporation into epididymal adipose tissue lipids: basal state vs. insulin added into incubation Krebs–Ringer bicarbonate buffer. (C) Lipolysis: release of NEFA and glycerol into incubation Krebs–Ringer phosphate buffer; re-esterification: counted as released NEFA/Glycerol ratio. (D,E) Changes in mRNA level of selected genes involved in lipid metabolism and senescence. Control group (n = 7) and empagliflozin group (n = 8). Empagliflozin group received a standard diet enriched by 0.01% empagliflozin for 6 weeks. Data are expressed as mean ± SEM; * p ˂ 0.05; ** p ˂ 0.01; *** p ˂ 0.001.

