Figure 5.
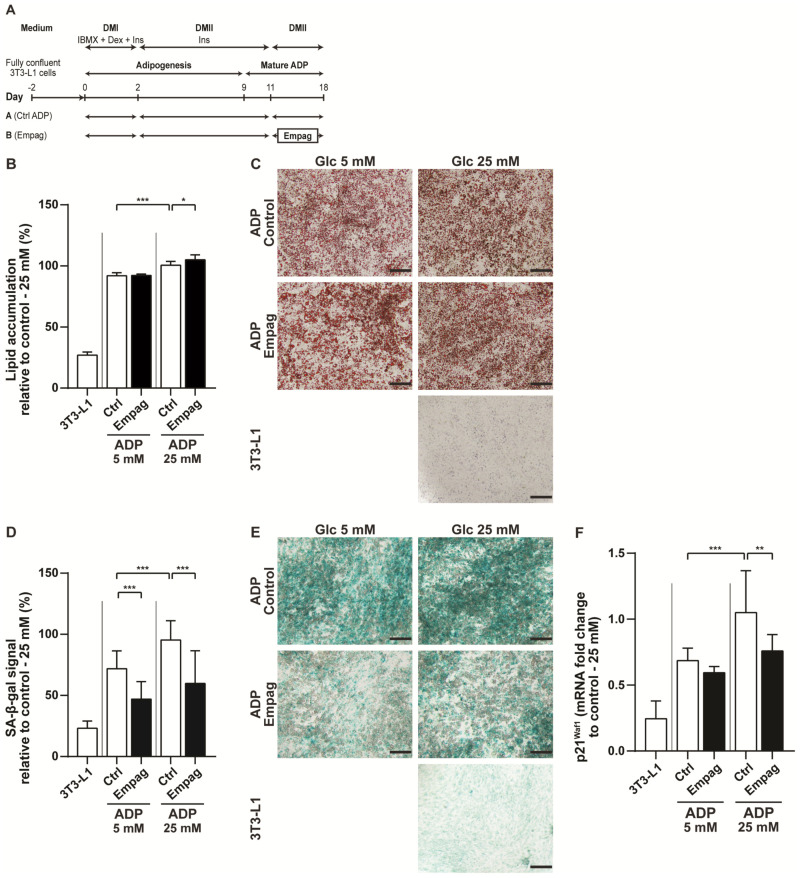
Effect of empagliflozin on mature 3T3-L1 adipocytes. (A) Time schedule of the 3T3-L1 preadipocytes (3T3-L1), differentiated into mature adipocytes (ADP) and then exposed to glucose (5 mM or 25 mM) together with or without empagliflozin treatment (500 nM) at time points as indicated. (B) Quantification of intracellular lipids accumulation using Oil Red O staining was performed in mature adipocytes and (C) representative images are shown. The bar indicates 200 μm. (D) Detection of senescent cells evaluated on senescence-associated beta-galactosidase (SA-β-gal) activity and (E) representative images are shown. The bar indicates 200 μm. (F) Changes of mRNA level of senescence marker p21Waf1. The results are derived from at least three independent experiments run in triplicates. Data are expressed as mean ± SD; * p ˂ 0.05; ** p ˂ 0.01; *** p ˂ 0.001.

