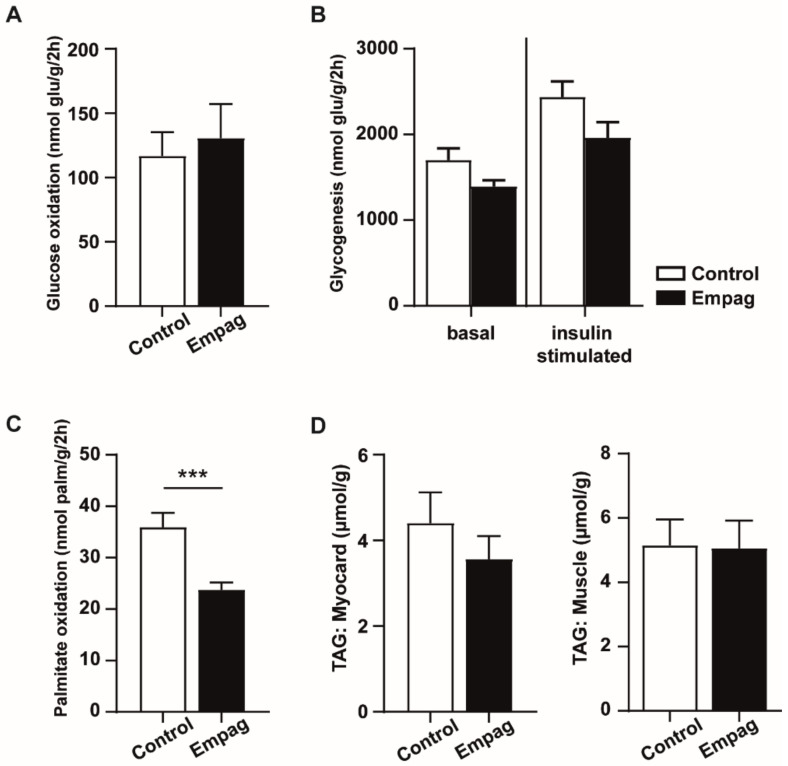
Figure 7.
Glucose metabolism in muscle, palmitate oxidation in heart and triglyceride content in muscle and heart. (A) Glucose oxidation was measured ex vivo by release of CO2. (B) Glucose incorporation into glycogen of diaphragm. (C) Palmitate oxidation measured ex vivo by the release of CO2 in myocardium. (D) TAG concentrations related to weight of tissue (myocardium and muscle gastrocnemius). Control group (n = 7) and empagliflozin group (n = 8). Empagliflozin group received a standard diet enriched by 0.01% empagliflozin for 6 weeks. Data are expressed as mean ± SEM; *** p ˂ 0.001.

