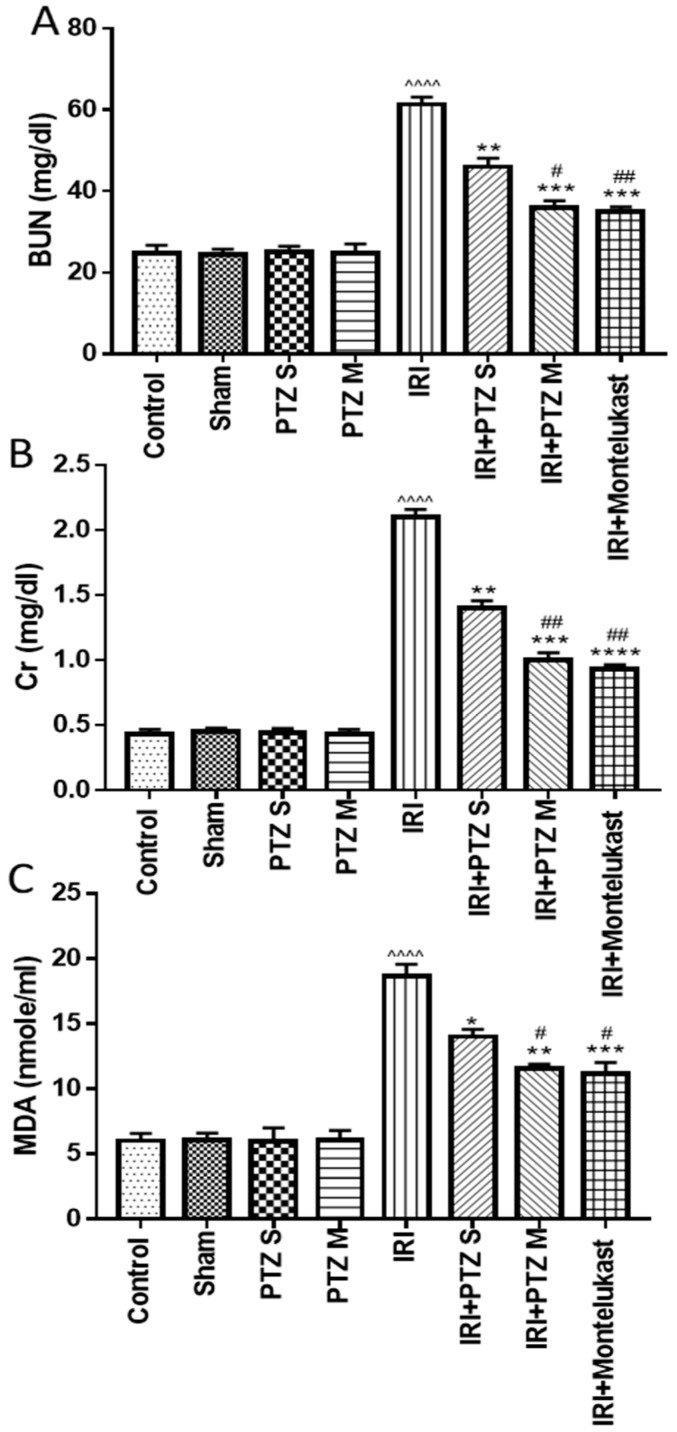
Figure 1.
Effect of various treatments on serum levels of BUN (A), Scr (B), and MDA (C). Bars represent mean ± SEM. Significant difference between groups is analyzed by Student’s t-test after one-way ANOVA test (n = 8), where: ^^^^: p < 0.0001, compared to normal control group. *: p < 0.05, **: p < 0.01, ***: p < 0.001, and ****: p < 0.0001, compared to IRI group. #: p < 0.05, ##: p < 0.01, compared to (IRI + PTZ S) group.

