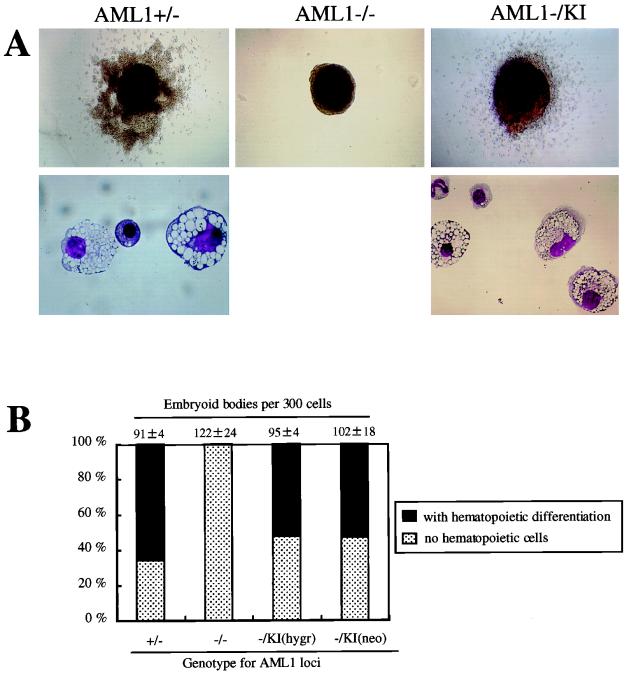
FIG. 2.
Results of the EB differentiation experiments of knock-in clones. (A) Appearance of the representative day 14 EBs derived from the ES cell clones of AML1+/− and AML1−/− and knock-in with wild-type AML1b (AML1−/KI) genotypes. AML1+/− ES cell clones formed EBs, the majority of which was surrounded by hematopoietic cells (upper left panel) consisting primarily of mature macrophages and a few erythroid and granulocytic cells (lower left panel). EBs derived from AML1−/− clones developed no such cells (center). In contrast, knock-in ES clones (AML1−/KI) formed hematopoietic cells around the EBs (upper right panel), consisting of macrophages with occasional granulocytes and erythrocytes (lower right panel). The morphology of the cells derived from the knock-in clones was indistinguishable from that of cells developed from control AML1+/− clones. Original magnifications: upper panels ×20, lower panels, ×132. (B) Incidence of hematopoietic differentiation of the day 14 EBs derived from ES cell clones of AML1+/−, AML1−/−, AML1−/− with a knock-in AML1b at the hygromycin allele [AML1−/KI(hygr)], and AML1−/− with a knock-in AML1b for the neomycin allele [AML1−/KI(neo)] genotypes in a representative experiment. Dark bars indicate the percentage of the EBs with visible hematopoietic cells whereas light bars represent those without a hematopoietic element. Actual numbers of the EBs grown per 300 ES cells are given above each bar as the mean ± standard deviation of triplicate cultures.

