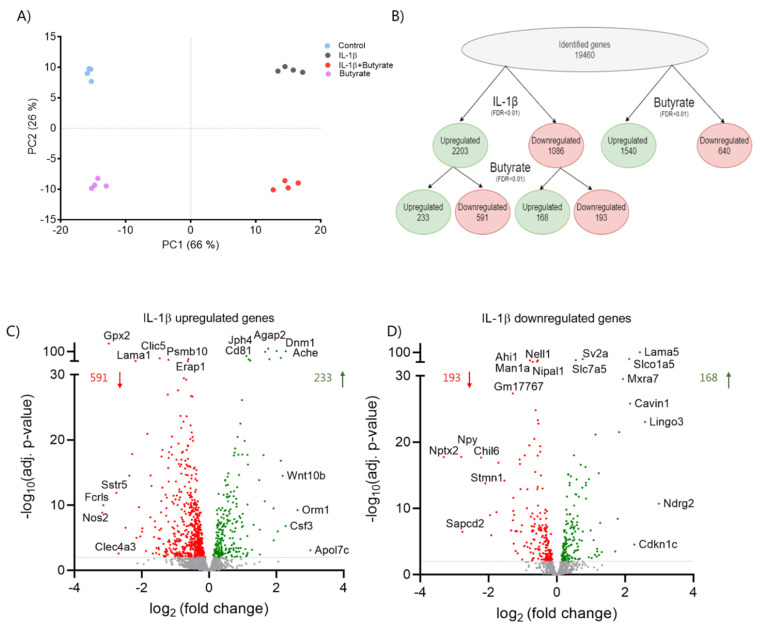
Figure 6.
Butyrate and IL-1β affect global gene expression in mouse islets. Mouse islets were cultured for 10 days in the absence or presence of 50 pg/mL IL-1β or 0.2 mM butyrate. RNA was isolated for RNA-sequencing analysis. (A) Principle component analysis (PCA) plot of the top 1000 most variable genes showing the clustering of the samples by exposure. Each dot represents a sample. The first two principal components (PC) are shown, and the percentage of variance explained by each PC is indicated. (B) Overview of differentially expressed genes between control vs. IL-1β (FDR adjusted p-value < 0.01), non-exposed vs. butyrate (FDR adjusted p-value < 0.01), and IL-1β vs. IL-1β plus butyrate (FDR adjusted p-value < 0.01) exposed mouse islets. (C,D) Volcano plots showing the effect of butyrate on IL-1β up- (2203 genes) or down-regulated genes (1086 genes). Each dot represents an individual gene. Red dots represent significantly downregulated genes (FDR adjusted p-value < 0.01), Green dots represent significantly upregulated genes (FDR adjusted p-value < 0.01). The top 5 most significantly (IL-1β vs. IL-1β plus butyrate) and top 5 most regulated genes are labeled. Data are shown as means of n = 4 independent experiments.

