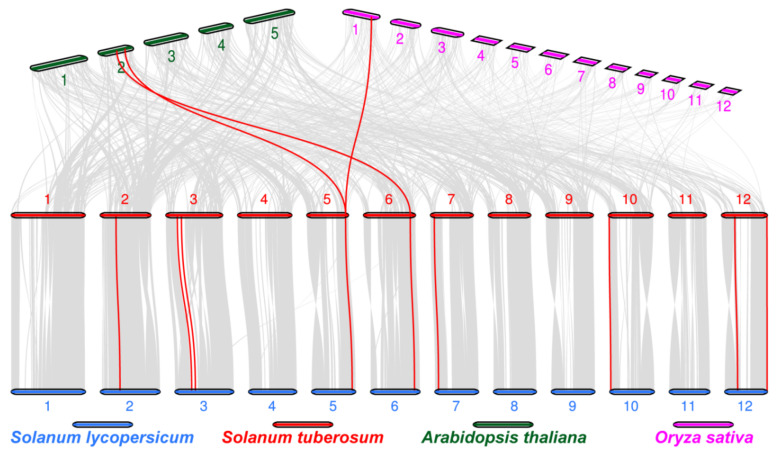
Figure 2.
Collinearity analysis of the MTPs in Arabidopsis thaliana, Oryza sativa, Solanum lycopersicum, and Solanum tuberosum. Different colors represent chromosomes of different species, and the number of each chromosome is labeled at their top or bottom. The gray lines indicate the collinear block of genome of the plants and the red line indicates the synonymous MTP gene pairs in potato.

