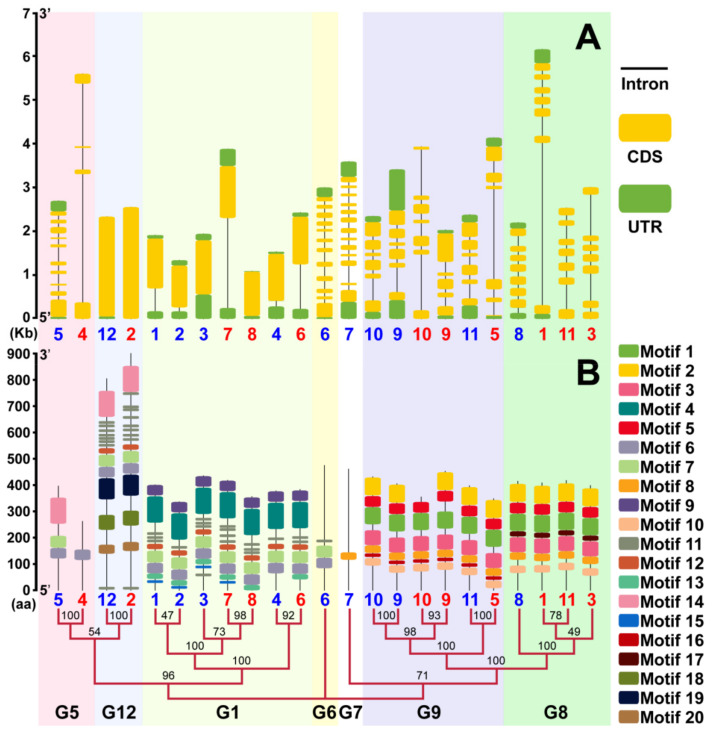
Figure 4.
StMTPs structure analysis and conservative motif analysis. StMTPs 1–11 is marked as red 1–11, blue numbers 1–12 represent AtMTP1-AtMTP12. (A): The exon-intron structure of StMTPs, the black line represents the introns, the yellow box denotes the untranslated 5′ and 3′ regions of the UTR and the green box indicated as the exons. The length of the exons, introns and untranslated regions were estimate by the scale bar. (B): Schematic diagram of conserved motifs. The different themes were represented by different colored boxes and the length of each sequence were marked. The scale bar on the left indicates the length of the MTP protein sequence.

