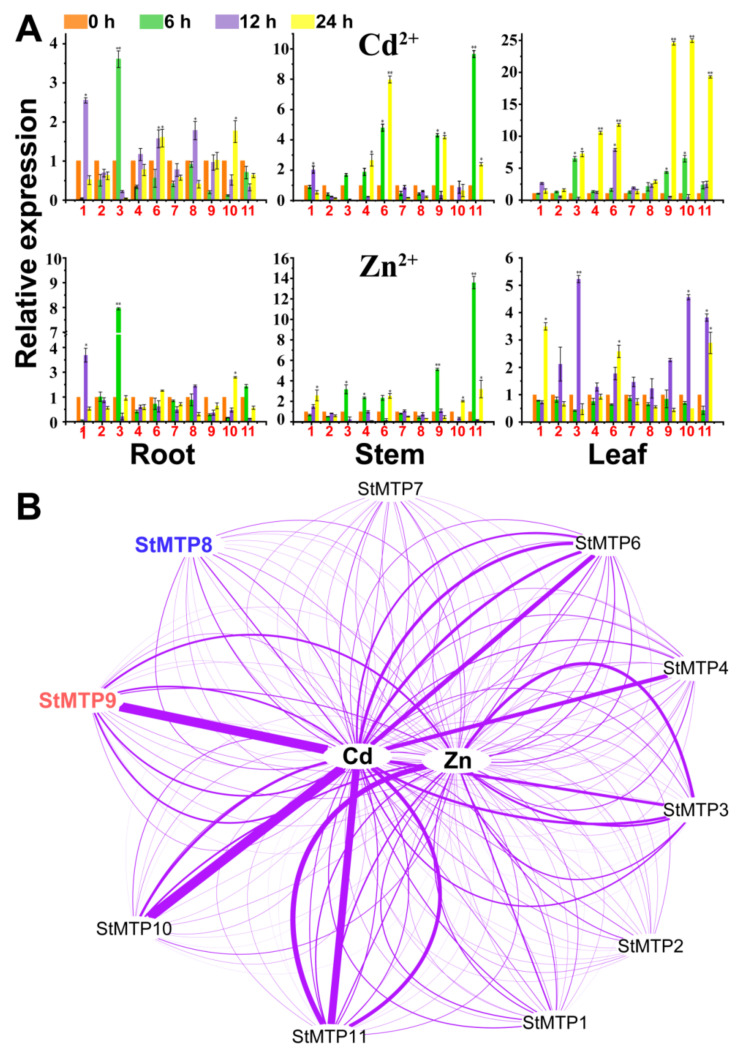
Figure 7.
The expression analysis of StMTPs under Zn and Cd stress. (A): The expression profile of StMTPs in root, steam and leaf. The StMTPs 1–11 were abbreviated as red font 1–11. * = p ≤ 0.05, ** = p ≤ 0.01. (B): A visual analysis network for the influence of heavy metals on StMTPs expression. The wider connection lines between the metal and the gene, the higher expressions of the gene under the metal stress conditions. StMTP8 marked in blue and StMTP9 were marked in red font were used for subsequent heterologous expression in yeast.

