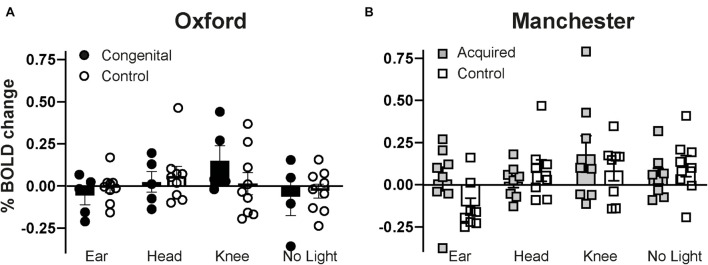
FIGURE 3.
Mean percentage BOLD signal change during each experimental condition (ear, head, knee, no light) extracted from the primary visual cortex (V1, as defined by the Juelich Histological Atlas in FSLview). Group mean values for each of the four experimental conditions are shown in (A) for Oxford and (B) for Manchester. Error bars represent standard error.

