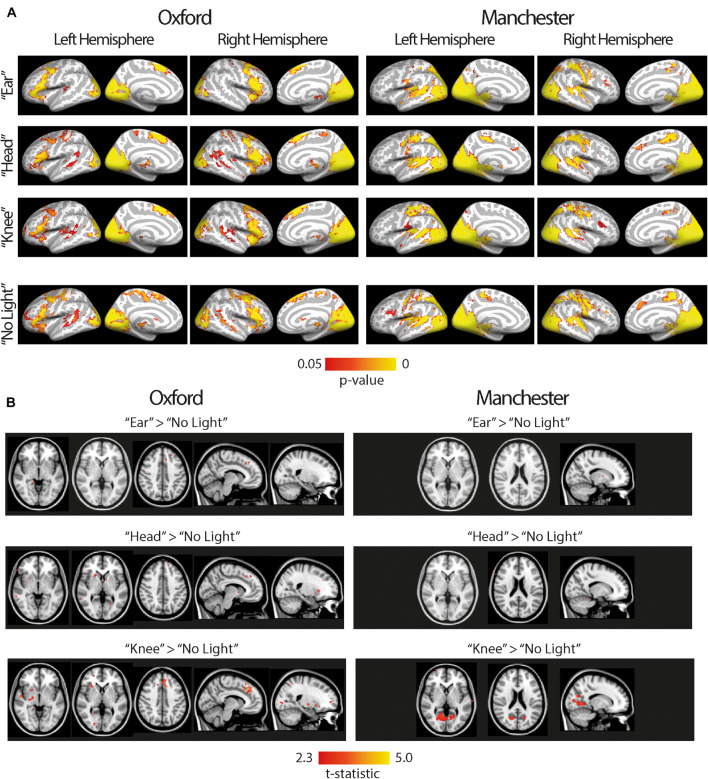
FIGURE 4.
The visual network for all subjects, both anophthalmia and control groups, at Oxford (left) and Manchester (right). (A) Shows brain areas that contribute to the visual network in all four experimental conditions (“ear,” “head,” “knee,” “no light”). For visualization purposes, statistical maps are overlaid using Freesurfer onto the inflated cortical surface of the left and right hemisphere average brain. The color bar shows the p-value range used to display significant functional connectivity, calculated using permutation testing and threshold-free cluster enhancement (P < 0.05). (B) Shows a contrast of each light condition (“ear,” “head,” “knee”) > “no light” condition. For visualization purposes, statistical maps are overlaid onto the MNI-152 standard brain using FSLview. Since clusters are small and do not survive cluster correction, uncorrected t-statistics are reported (T > 2.3).

