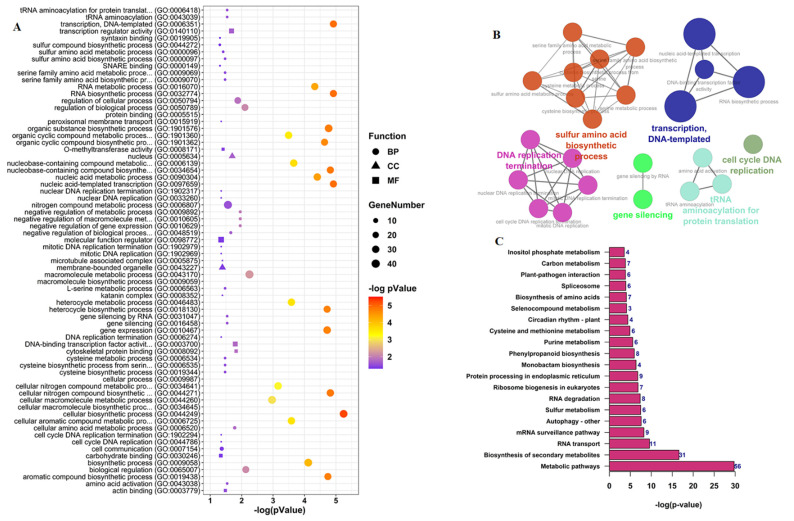
Figure 7.
Functional analysis of miRNA target genes during B. rapa pollen development. (A) GO enrichment analysis. (B) ClueGO network visualizing the most significant GO terms—colors represent GO groups. (C) KEGG enrichment analysis. The number on the bars represent the number of genes enriched in the corresponding pathways.

