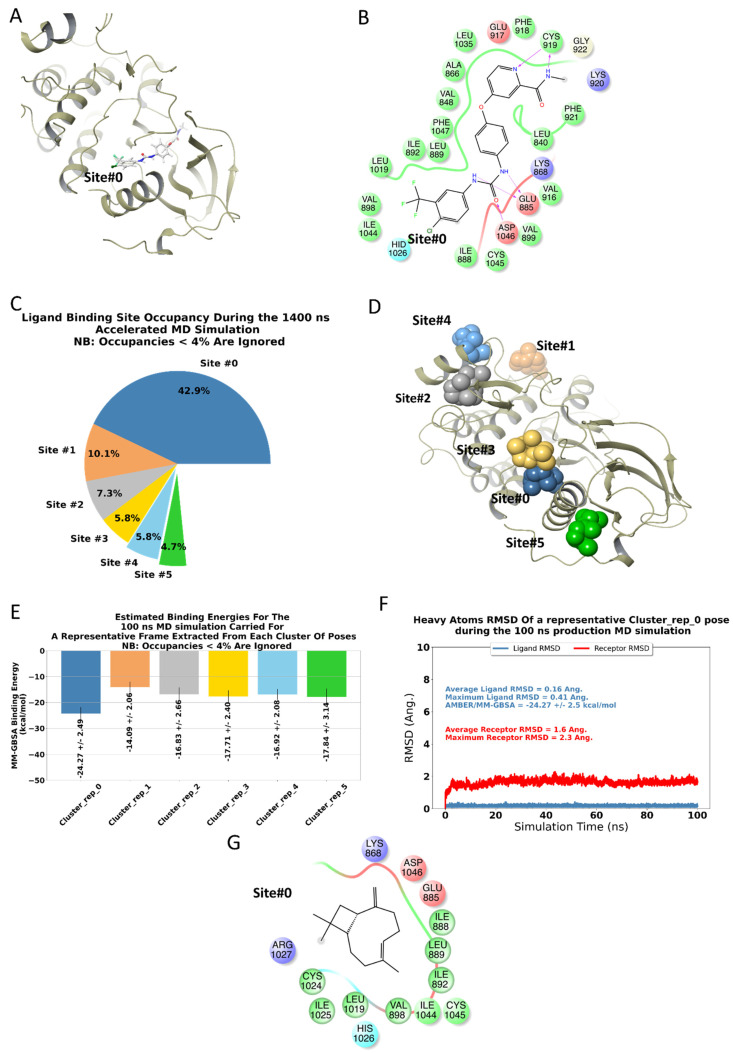
Figure 3.
BCP has a binding site on the surface of VEGFR2 based on computational structural analysis: summary of the computational analyses performed in the current study. (A,B) represent the 3- & 2-dimensional ligand interaction diagrams, respectively, of the co-crystallized ligand, Sorafenib, with the kinase domain of VEGFR2 (PDB code: 3WZE). A pie chart representing potential BCP binding sites occupancies, obtained through clustering the full 1.4 μs accelerated MD trajectory (C). Representative conformations of BCP within these sites were given in figure (D) and color-coded using the same scheme displayed in the pie chart. Each of these representative conformations was subjected to 100 ns MD classical MD simulations, and the corresponding AMBER/MM-GBSA binding energy data was given in figure (E); again, with the same color codes of Figures (C,D). To enhance the clarity of the figures, we decided to depict the representative conformations and binding energies plots only for the top 6 clusters. Notably, Site#0 represents the most probable site of BCP, given the high fractional binding site occupancy and the better binding affinity compared to other sites. The RMSD plots presented in Figure (F) of the classical trajectory of BCP bound to Site#0 show stable trajectories for the ligand, and the receptor, a 2D ligand interaction diagram of BCP within Site#0 was given in Figure (G).

