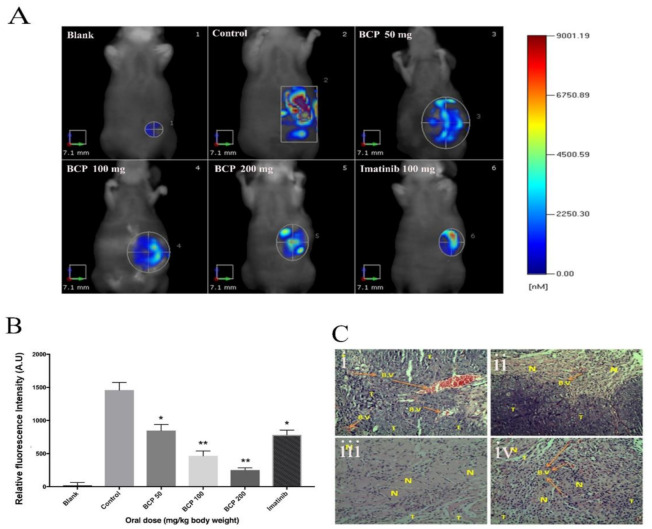
Figure 6.
BCP inhibited tumor growth in an orthotopic tumor model as detected by Fluorescent Molecular Tomography. Photographic images represent the anti-tumor activity of BCP. HCT 116 tumor cells implanted orthotopically in the cecal wall of the nude mouse; (A) (1) Blank: normal mice, (2) negative control: untreated mice bearing tumor, (3) mice treated with 50 mg/kg of BCP, (4) mice treated with 100 mg/kg of BCP, (5) mice treated with 200 mg/kg of BCP and (6) positive control: mice treated with 100 mg/kg of Imatinib. (B) Graphical representation of the fluorescent intensity of the tumor in mice treated without and with BCP detected by Fluorescent Molecular Tomography. All data were represented as mean ± SD, n = 5, * p < 0.05 and ** p < 0.01 compared to control. (C) Cross-sections of orthotopic tumor tissues stained with hematoxylin/eosin. The pictures were captured at 20× magnification. (i) Negative control with more blood vessels, (ii) 100 mg/kg of BCP, (iii) 200 mg/kg of BCP, and (iv) positive control: 100 mg/kg of imatinib. (B.V) refers to the blood vessels, (T) refers to viable tumor cells, and (N) refers to necrotic/apoptotic tumor cells.

