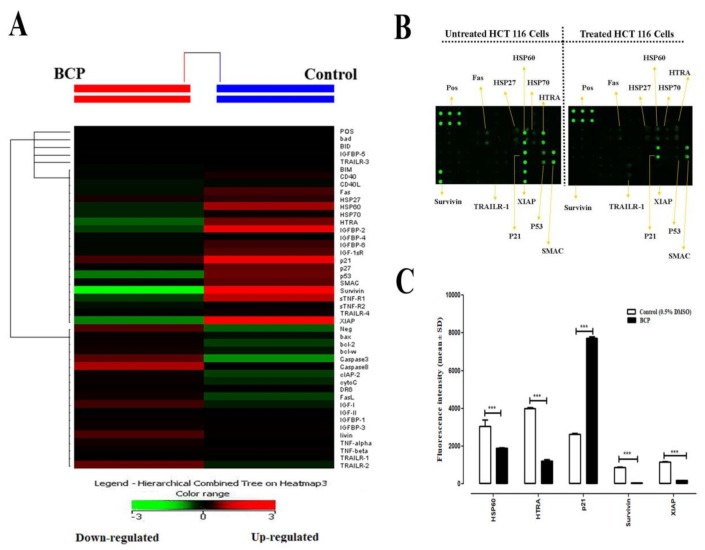
Figure 8.
Effect of BCP on the expression of apoptosis-related proteins in HCT 116 cells. Cells were treated with 20 μM BCP for 24 h. Cells were lysed, the whole-cell protein was extracted, and protein array was performed. (A) A cluster diagram (heat map) shows signal intensities from each protein. (B) Images of the apoptotic markers were presented for the untreated and BCP-treated cells. Positive Control Spots (POS) were used for normalization and orientate the arrays. (C) Relative fold change in the expression levels of various pro- and anti-apoptotic proteins after treatment of BCP with HCT 116 cells. The statistical analysis was performed by assuming a value of 1 in control for reported proteins. The data was represented as the mean ± SD (n = 3). *** p < 0.001 compared to DMSO-treated control group.

