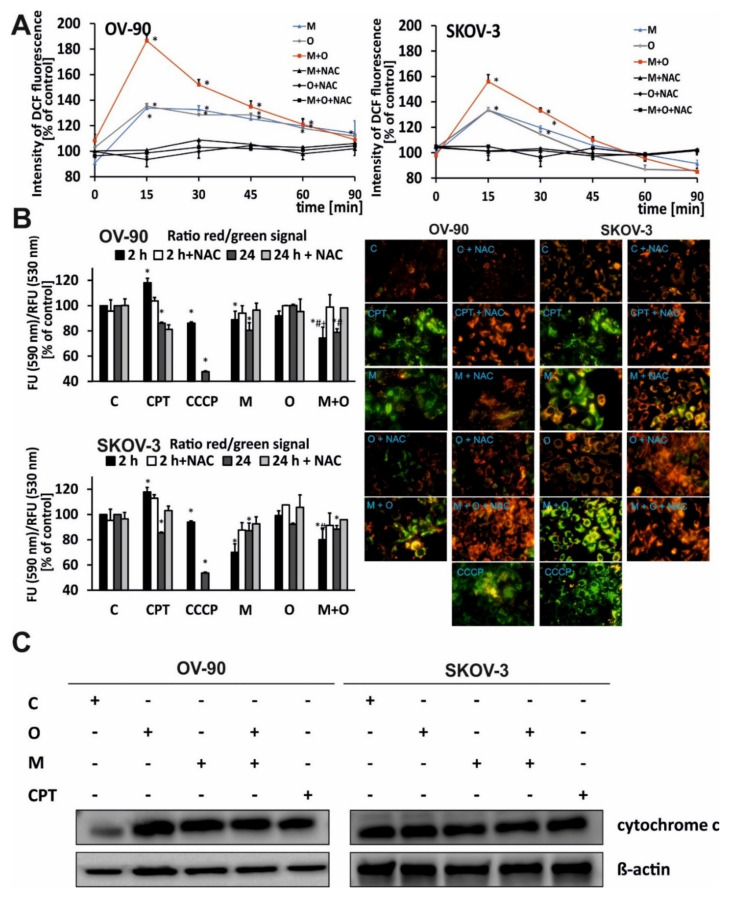
Figure 3.
Metformin combined with olaparib induced oxidative stress and decreased the mitochondrial membrane potential. (A) The kinetics of ROS generation in OV-90 and SKOV-3 cells treated with O (20 µM), M (20 mM), or O (20 µM) + M (20 mM) were measured for up to 90 min in the presence or absence of an antioxidant (NAC); C: control, CPT: Camptothecin. (B) The fluorescence ratio of JC-1 dimers/JC-1 monomers in the control was assumed to be 100%. OV-90 and SKOV-3 cells were stained with the fluorescence probe JC-1 after 24 h of incubation with O (20 µM), M (20 mM), or O (20 µM) + M (20 mM) or carbonyl cyanide m-chlorophenyl hydrazone (CCCP) (10 µM), or CPT (5 µM). (C) Cytochrome c and β-actin expression was analyzed by western blotting. All data are from three biologic assays and are graphed as the mean ± SD. * p < 0.05 for olaparib, metformin, or a combination of both drugs vs. control cells; # p < 0.05 for olaparib vs. com-bination (O + M); + p < 0.05 for metformin vs. combination (O + M).

