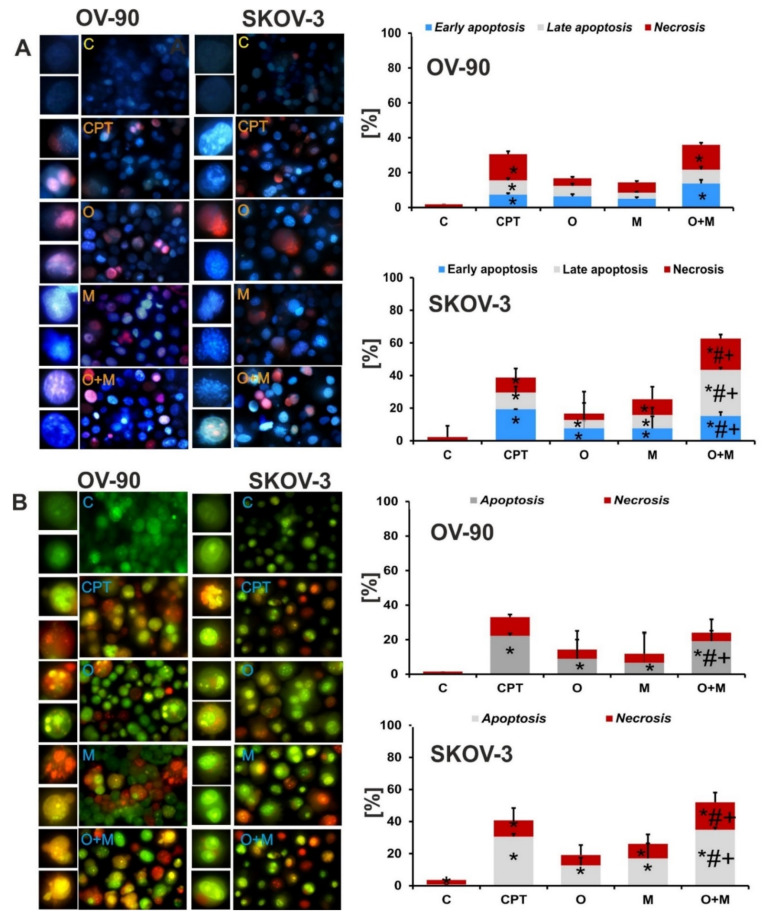
Figure 4.
Combination treatment caused a greater cell death in both tested cell lines compared with each drug alone. Representative images of the apoptotic and necrotic changes caused by the compounds; C: control. The cells were visualized under a fluorescence microscope (Olympus IX70). (A) Apoptotic and necrotic changes visualized after double staining with Hoechst 33258/propidium iodide. (B) Apoptotic and necrotic changes visualized with acridine orange and ethidium bromide staining. Data are from three biologic assays and are graphed as the mean ± SD. * p < 0.05 for olaparib, metformin, or a combination of both drugs vs. control cells; # p < 0.05 for olaparib vs. combination (O + M); and + p < 0.05 for metformin vs. combination (O + M).

