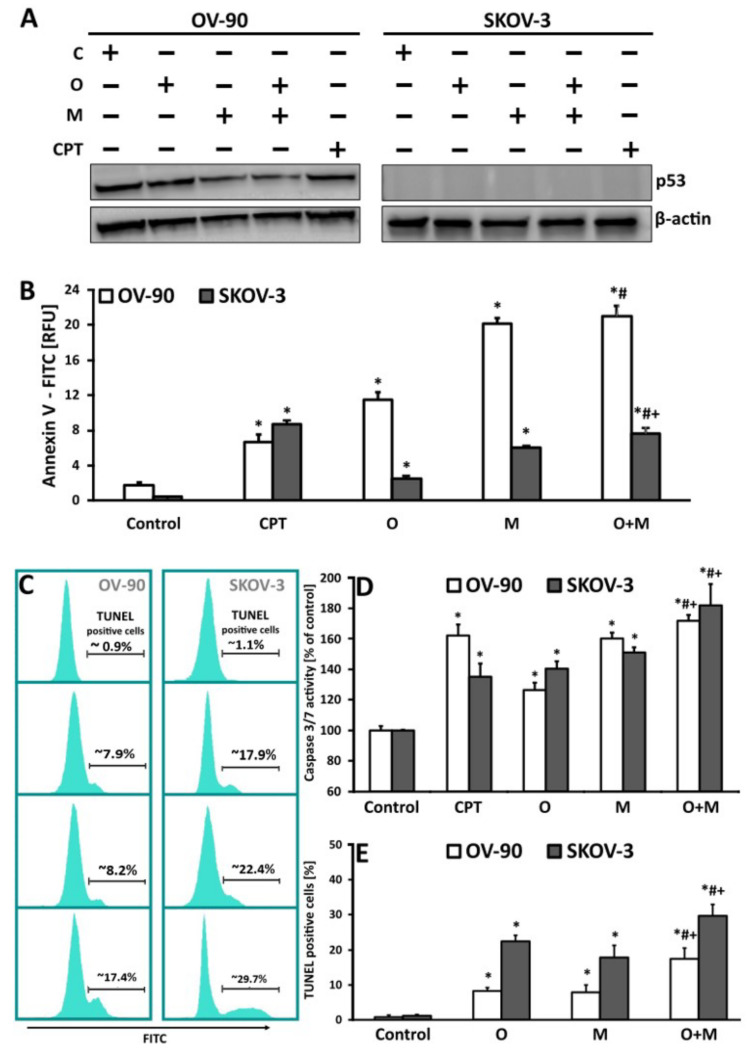
Figure 5.
DNA damage and the rate of apoptosis induced by olaparib, metformin, and their combination in OV-90 and SKOV-3 cells. (A) The cells were treated with O (20 µM), M (20 mM), or O (20 µM) + M (20 mM) with or without CPT (5 µM) and lysates were collected at 24 h. p53 and β-actin expression was analyzed by western blotting. SKOV-3 has no p53 activity. (B) After 24 h of drug treatment, the intensity of Annexin fluorescence was measured in cells with exposed PS. The results are presented as relative fluorescence units [RFU]. (C) Representative histograms obtained for samples treated with metformin or olaparib and its combination. The position of the marker representing TUNEL-positive cells (with fragmented DNA) was adjusted according to the negative control. (D) Changes in the activity of caspase 3/7 after exposure of SKOV-3 and OV-90 cell lines to metformin or olaparib and their combination for 24 h. The results are presented as a percentage activity of caspase 3/7, where the fluorescence value of the un-treated control was taken as 100%. (E) The effect of metformin, olaparib, and their combination on the induction of DNA damage in the SKOV-3 and OV-90 cancer cell lines, as estimated by the TUNEL assay. All data are from the three biologic assays and are graphed as the mean ± SD. * p < 0.05 for olaparib, metformin, or a combination of both drugs vs. control cells; # p < 0.05 for olaparib vs. combination (O + M); + p < 0.05 for metformin vs. combination (O + M).

