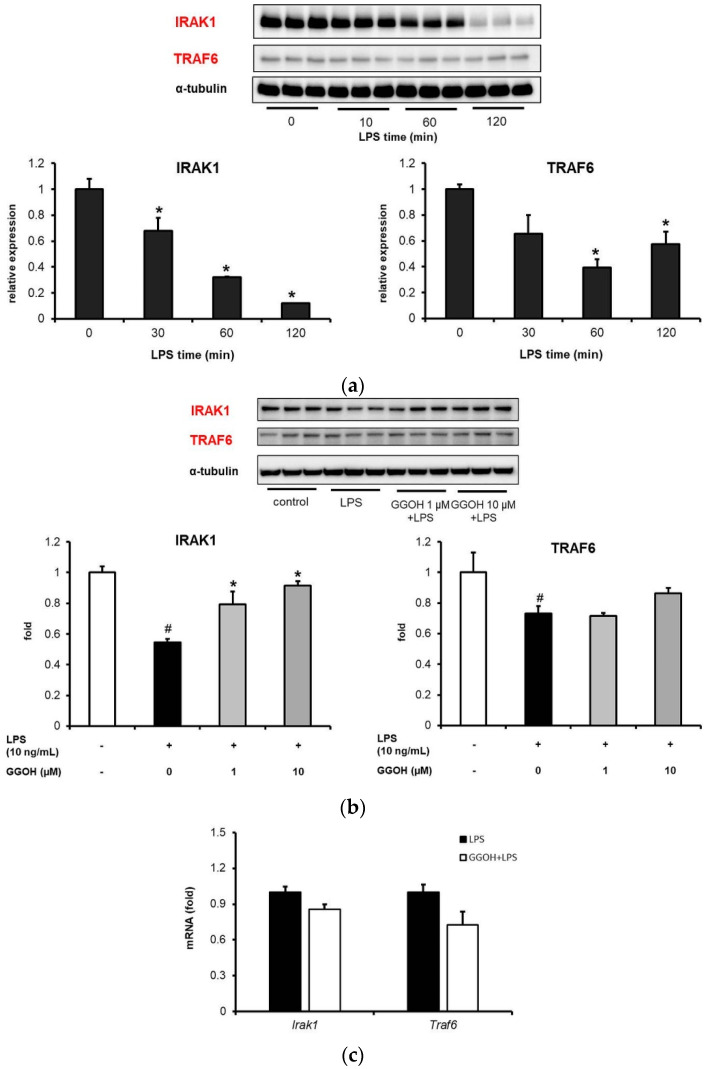
Figure 5.
Reversal of LPS-induced NF-κB upstream protein expression by geranylgeraniol (GGOH) administration. MG6 cells were pre-treated with GGOH for 24 h followed by LPS treatment (10 ng/mL) for 1 h. (a) Western blot images and quantifications of IRAK1 and TRAF6 expression levels after different LPS administration times. (b) Western blot images and quantifications of IRAK1 and TRAF6 expression levels in the presence of GGOH followed LPS treatment for 1 h. (c) Irak1 and Traf6 mRNA expression levels after 1 h of LPS treatment. Total cell lysates were collected and subjected to Western blot analysis or qRT-PCR. Data are presented as the mean ± S.E.M, n = 3, normalized to total protein levels detected based on α-tubulin or Eef1a1 as internal standards. # p < 0.05 vs. untreated control; * p < 0.05 vs. LPS-only treatment or LPS in 0 min.

