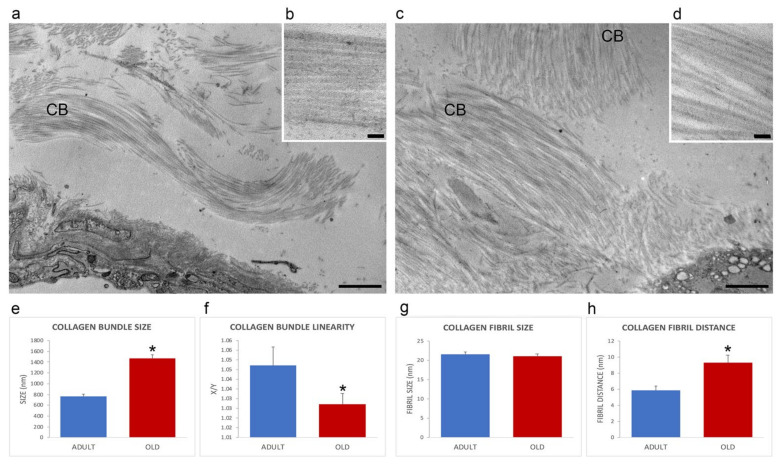
Figure 3.
Ultrastructural images (a–d) of the perimysium of adult (a,b) and old (c,d) gastrocnemius muscle. CB, collagen bundle. (a,c), bars: 1 µm; (b,d), bars: 100 nm. Morphometric analysis of collagen bundles and collagen fibrils features are reported in the histograms (e–h). X/Y, ratio between the real length of the collagen bundle profile and the corresponding linear length. * p < 0.05.

