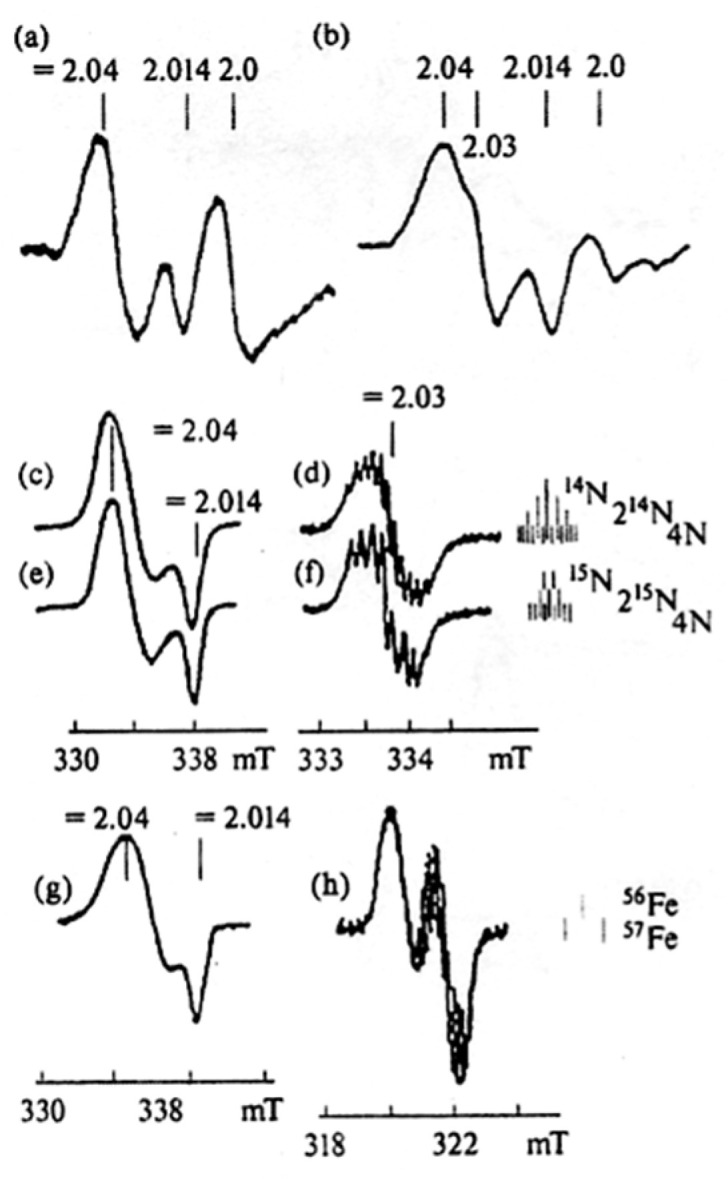
Figure 6.

The 2.03 signals recorded in wet preparations of rabbit liver (curve (a)) and yeasts (curve (b)) and the EPR spectra of aqueous solutions of DNIC with cysteine containing 14NO (curves (c,d)), 15NO (curves (e,f) or 57Fe (curves g,h) The EPR signals were recorded at ambient temperature (curves (a,b,d,f,h)) or at 77 K (curves (c,e,g)). Right panel: identification of characteristic HFS of DNIC with cysteine [22].
