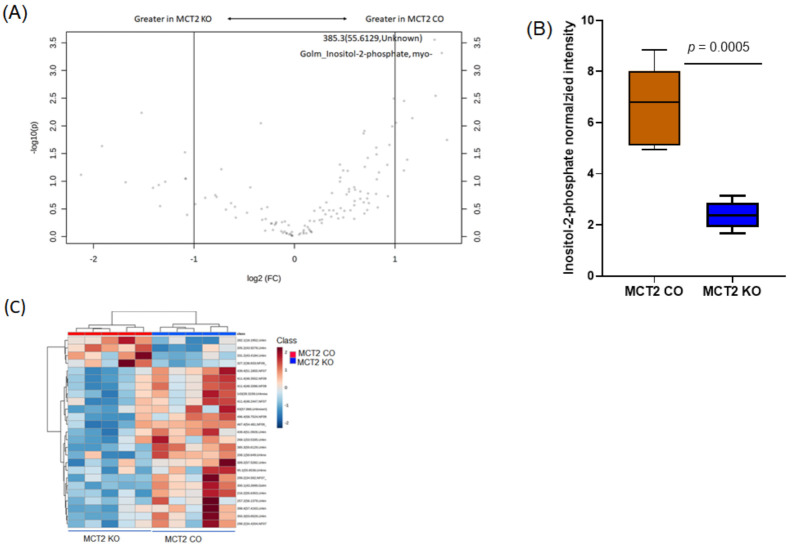
Figure 10.
Fecal non-polar gas chromatography−mass spectroscopy (GC−MS). (A) Volcano plot showing fold difference (x-axis) and p-value (y-axis) associated with polar metabolites. (B) Tukey box plots showing the significant abundance of five metabolites in MCT2 KO and CO mice. (C) Hierarchical clustering of samples based on the relative abundance of the ASVs.

