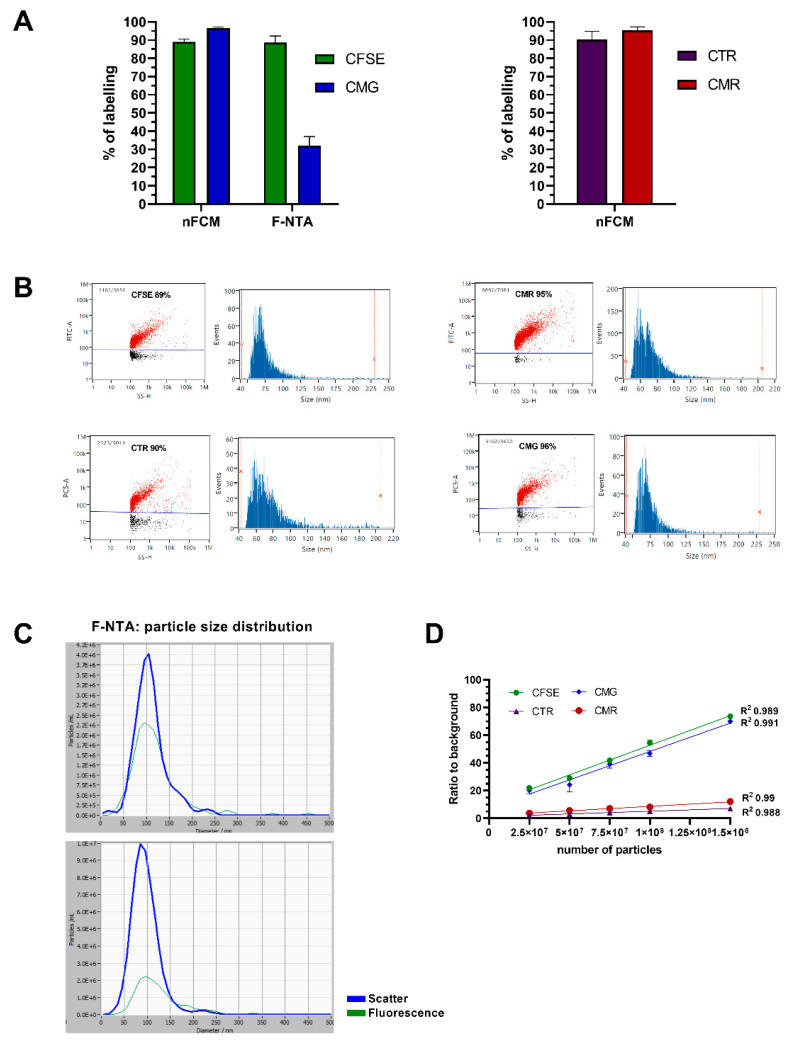
Figure 1.
Fluorescence measurements on nFCM, F-NTA and plate reader after sEV staining with membrane and cytoplasmic dyes. (A) HT29 sEVs were stained with membrane-specific (CMG or CMR) or cytoplasmic dyes (CFSE or CTR) and analyzed on nFCM and F-NTA to evaluate labeling %. Data is presented as mean ± SEM of at least three independent experiments (except for nFCM-CMG and CMR, and F-NTA-CFSE, which were repeated twice). (B) Representative nFCM dot-plots and PSD histograms, and (C) histograms obtained after analyzing EVs by F-NTA in scatter and fluorescence mode. (D) Bulk fluorescence intensity of a dilution series of stained HT29 EVs was measured by plate reader. Signal over background (PBS) ratios are represented and trendlines drawn for the assessment of correlations. Additional data from procedural controls is provided in Supplementary Figure S1.

