Figure 2.
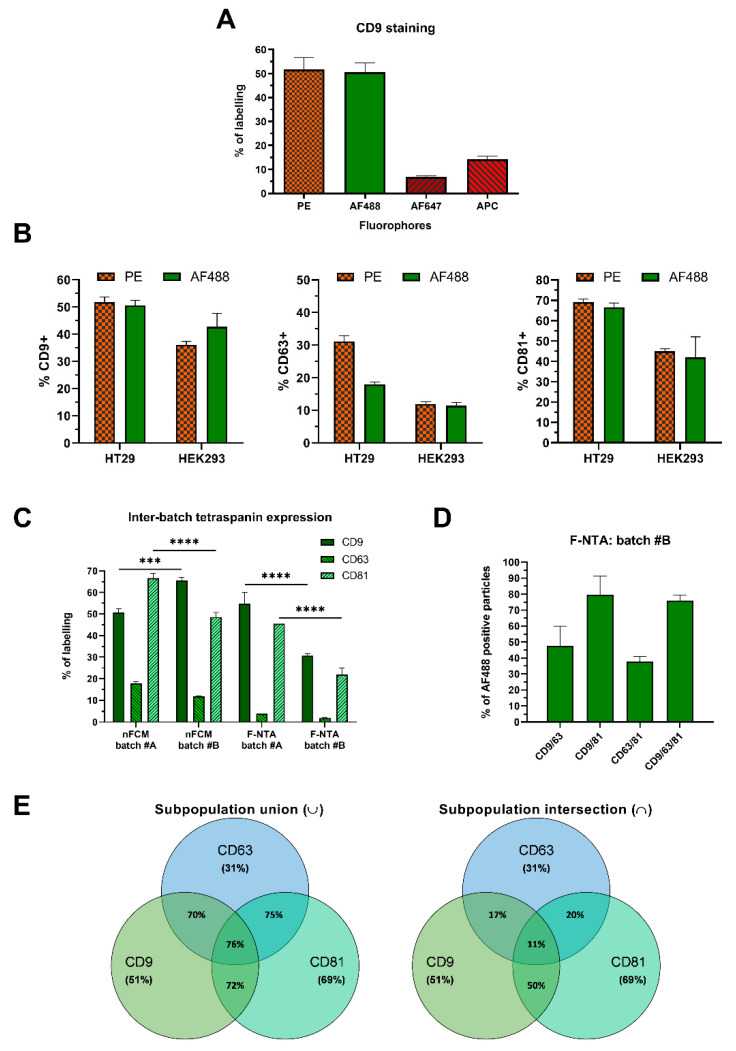
Characterization of purified sEV subpopulations based on their surface markers. (A) Antibody staining efficiency was evaluated by nFCM using anti-CD9 antibodies conjugated with different fluorophores. (B) HT29 and HEK293 sEVs were stained with anti-tetraspanin (CD9, CD63, and CD81) antibodies, conjugated with either PE or AF488, and analyzed on nFCM (n ≥ 3; mean ± SEM). (C) Cross-platform and inter-batch variability was assessed by single-staining HT29 sEV (batches #A and #B) with anti-tetraspanin AF488 antibodies (n = 3; mean ± SEM). Differences in tetraspanin expression between nFCM and F-NTA, and batches #A and #B, were assessed using two-way ANOVA with Tukey’s test for multiple comparisons (alpha = 0.05, p = 0.1234 (ns), 0.0002 (***), <0.0001 (****)). Detailed results of the statistical analysis are provided as supplementary material. (D) To evaluate single, as well as co-expressing, events, HT29 sEVs were stained with a mix of 2 and 3 different anti-tetraspanin AF488 antibodies and analyzed on F-NTA (n = 3; mean ± SEM), or on (E) nFCM using PE-conjugated antibodies (n = 3; mean ± SEM). HT29 sEV subpopulations expressing either 1, 2, or 3 markers are represented in the Venn diagram on the left. The Venn diagram on the right refers to the same HT29 sEVs, however it depicts subpopulations co-expressing both 2 or 3 markers simultaneously. Additional data from procedural controls, as well as the F-NTA PSD histograms, are provided in Supplementary Figure S1.

