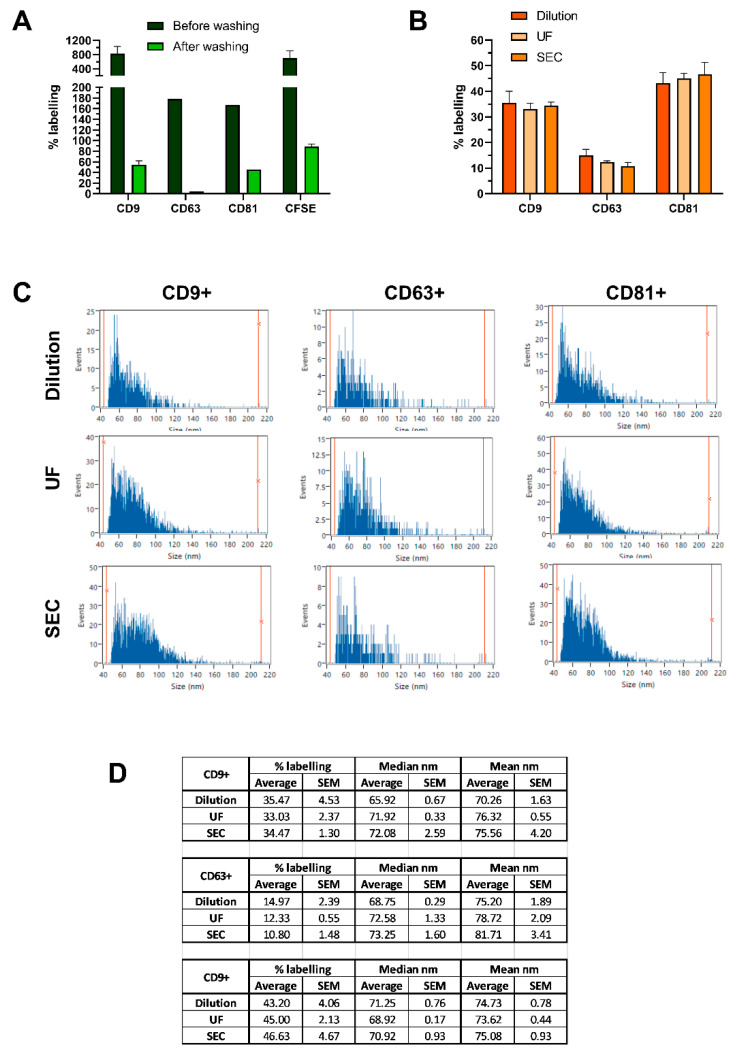
Figure 3.
Suitability of SEC and UF as methods for clearing dyes in excess after sEV fluorescent labeling and their effect on subpopulation ratios. (A) Comparison of labeling % for stained HT29 sEVs before and after the removal of excess dye. 1 × 10⁹ or 5.5 × 10⁹ sEVs were incubated with antibodies (aCD9 1:12.5; aCD63 1:12.5; aCD81 1:25) or CFSE (50 µM), respectively, and measured by F-NTA. To remove the excess dye, UF washing strategy was applied, followed by F-NTA detection. (B) To compare different strategies for the removal of fluorescent antibodies in excess, labeling %, (C) PSD histograms, and (D) median and mean particle diameter were assessed for CD9+, CD63+ and CD81+ HEK293 sEVs, on nFCM. 2 × 10⁹ sEVs, at a concentration of 108 particles/µL, were incubated with PE-labelled antibodies (aCD9 1:500; aCD63 1:25; aCD81 1:500) and unbound antibodies were removed by SEC or UF. Sample dilution (500–1000-fold) served as staining reference. Data is presented as mean ± SEM of at least three independent experiments. F-NTA PSD histograms of samples analyzed before and after washing are provided in Supplementary Figure S2.

