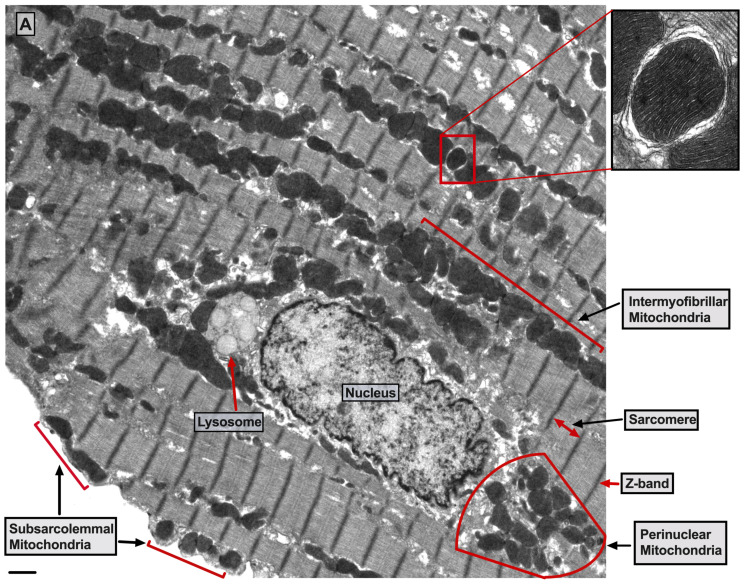
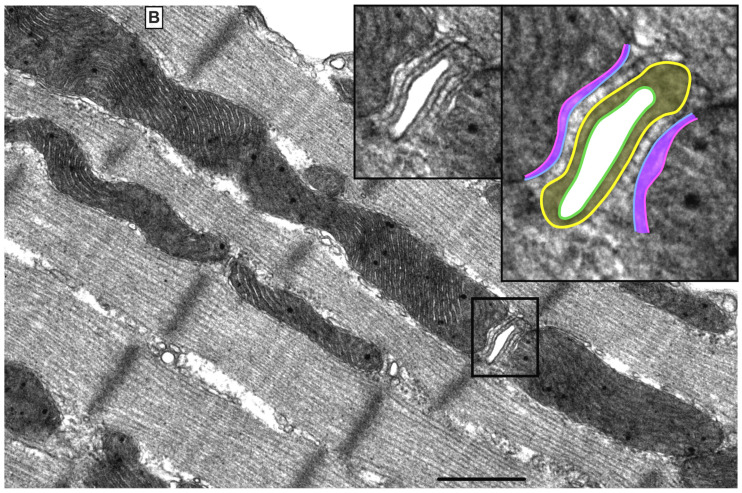
Figure 1.
Ultrastructure of normal myocardium. (A) Transmission electron photomicrograph of adult cardiac myocyte showing perinuclear, intermyofibrillar and subsarcolemmal mitochondria. Red box in the figure is defining the zoomed image showing mitochondrion-containing autophagosome. Image 5k × magnified, scale bar 1 μm. (B) Transmission electron photomicrograph of adult cardiac myocyte showing the relationship of the intermyofibrillar mitochondria with the adjacent T-tubules and sarcomeres. Image 40k × magnified, scale bar 1 μm. Tracing in the zoomed image, defined by the black box, shows T-tubule (green line surrounding white area), junctional sarcoplasmic reticulum (yellow line with yellow shaded area), outer mitochondrial membrane (Blue line), inner mitochondrial membrane (pink line) and intermembrane space (purple shaded area).


