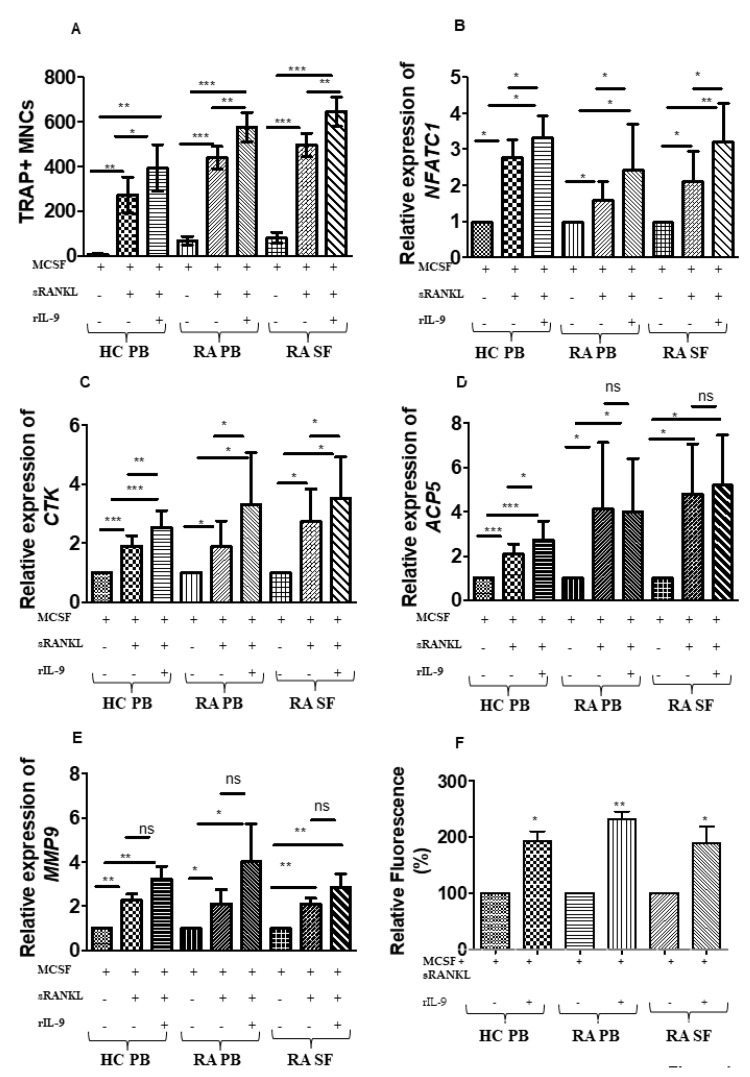
Figure 1.
Interleukin (IL)-9 enhances osteoclast formation and function in cells derived from RA and HC. (A) Cells derived from peripheral blood (PB) of healthy control (HC); cells derived from PB and synovial fluid (SF) of patients with RA were treated as indicated with macrophage colony-stimulating factor (M-CSF; 25 ng/mL), soluble receptor activator of nuclear factor κB ligand (sRANKL; 50 ng/mL), or IL-9 (100 ng/mL) for 21 days. Half of the culture medium was replenished with fresh culture medium containing stimulating factors (M-CSF, sRANKL, and rIL-9) at 4-day intervals. Cells were then fixed and stained for tartrate-resistant acid phosphatase (TRAP). Using a light microscope, multinucleated (≥3 nuclei) TRAP+ cells were counted manually. Graph shows TRAP+ multinucleated cells (MNCs) (mean ± SD; n = 5). Statistical analysis was performed using paired Student’s t-test comparing M-CSF/sRANKL/rIL-9-treated cells to M-CSF/sRANKL, M-CSF, or M-CSF/sRANKL-treated cells to M-CSF (*: p ≤ 0.05; **: p ≤ 0.005; ***: p ≤ 0.0005). (B–E) Cells derived from PB of HC, PB, and SF of patients with RA were stimulated as indicated with M-CSF (25 ng/mL), sRANKL (50 ng/mL), or IL-9 (100 ng/mL) for 3 days. Cells were then lysed followed by RNA extraction and cDNA preparation. Quantitative real-time PCR (RT-PCR) was performed for osteoclast-specific marker genes, nuclear factor of activated T-cells, cytoplasmic 1 (NFATc1), cathepsin K (CTSK), acid phosphatase 5, tartrate-resistant (ACP5), and matrix metalloproteinase-9 (MMP-9). The graphs represent the relative expression of NFATc1, CTSK, ACP5, and MMP-9 (mean ± SD; n = 8). Statistical analysis was performed using paired Student’s t-test comparing M-CSF/sRANKL/rIL-9-treated cells to M-CSF/sRANKL-, M-CSF-, or M-CSF/sRANKL-treated cells to M-CSF (*: p ≤ 0.05; **: p ≤ 0.005; ***: p ≤ 0.0005; ns –non significant). (F) Cells derived from PB of HC, PB, and SF of patients with RA were stimulated with M-CSF (25 ng/mL), sRANKL (100 ng/mL), or IL-9 (100 ng/mL) as indicated for 24 days. Half of the culture medium was replenished with fresh culture medium containing stimulating factors (M-CSF, sRANKL, and rIL-9) at 4-day intervals. Using a fluorometer, fluorescence intensity of the culture supernatant was measured. The graph represents the relative fluorescence intensity (mean ± SD; n = 3). Statistical analysis was performed using paired Student’s t-test comparing M-CSF/sRANKL/rIL-9-treated cells to M-CSF/sRANKL-treated cells. (*: p ≤ 0.05; **: p ≤ 0.005).

