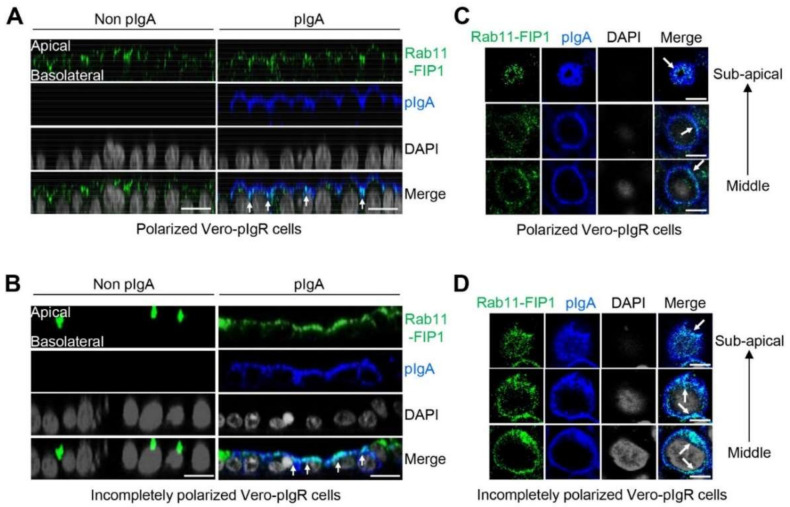
Figure 2.
Rab11−FIP1 colocalizes with pIgA during pIgA transcytosis. (A,B) Analysis of Rab11−FIP1 distribution in polarized and incompletely polarized cells. Vero−pIgR cells (1 × 10⁵) were grown on 12 mm diameter Transwell (0.4 µm pore) for 6 days (A). Vero−pIgR cells (1 × 10⁵) were grown on 12 mm diameter Transwell (0.4 µm pore) for 3 days (B). An amount of 20 µg pIgA was added or not added to the basal chamber for 1 h. The cells were fixed with 4% paraformaldehyde and stained with the indicated antibodies before observation by confocal microscopy. Scale bar: 20 µm. (C,D) Analysis of Rab11−FIP1 and pIgA distribution at different regions of Vero−pIgR cells. Vero−pIgR cells (1 × 10⁵) were grown on Transwell for 6 days (C). Vero−pIgR cells (1 × 10⁵) were grown on 12 mm diameter Transwell (0.4 µm pore) for 3 days (D). An amount of 20 µg pIgA was added to the basal chamber for 1 h. Subsequently, cells were fixed with 4% paraformaldehyde and stained with the indicated antibodies before observation by confocal microscopy. Cells in the same field of vision were successively observed from the middle region to subapical region. Scale bar: 10 µm. Data of (A–D) are representative of three independent experiments.

